Exam 3: Demand and Supply
Exam 1: The Nature of Economics347 Questions
Exam 2: Scarcity and the World of Trade-Offs411 Questions
Exam 3: Demand and Supply448 Questions
Exam 3: Extensions of Demand and Supply Analysis399 Questions
Exam 4: Public Spending and Public Choice346 Questions
Exam 5: Funding the Public Sector202 Questions
Exam 6: Demand and Supply Elasticity413 Questions
Exam 7: Consumer Choice458 Questions
Exam 8: Rents, profits, and the Financial Environment of Business445 Questions
Exam 9: The Firm: Cost and Output Determination387 Questions
Exam 10: Perfect Competition431 Questions
Exam 11: Monopoly386 Questions
Exam 12: Monopolistic Competition309 Questions
Exam 13: Oligopoly and Strategic Behavior307 Questions
Exam 14: Regulation and Antitrust Policy in a Globalized Economy309 Questions
Exam 15: The Labor Market: Demand, supply and Outsourcing376 Questions
Exam 16: Unions and Labor Market Monopoly Power318 Questions
Exam 17: Income, poverty, and Health Care302 Questions
Exam 18: Environmental Economics300 Questions
Exam 19: Comparative Advantage and the Open Economy314 Questions
Exam 20: Exchange Rates and the Balance of Payments300 Questions
Select questions type
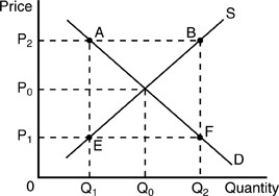 -Refer to the above figure.Other things being equal,if price is at P2 ,then we would expect
(Multiple Choice)
4.7/5  (45)
(45)
The price of a new textbook is $60 in one year and $75 two years later,while the price of a used copy of the textbook increased from $25 to $37.50.The relative price of a new textbook
(Multiple Choice)
4.8/5 (38)
Price per Constant Quality of X Quantity of X Demanded per Time Period Quantity of X Supplied per Time Period \ 10 0 150 8 20 120 6 40 90 4 60 60 2 80 30 0 100 0
-Given the market data for good X in the above table,an equilibrium quantity is established at
(Multiple Choice)
4.9/5 (42)
Which of the following will NOT cause a rightward shift in the supply curve?
(Multiple Choice)
4.8/5 (37)
Price per Constant- Quality Unit Quantity Demanded of Constant-Quality Units per Year Quantity Supplied of Constant-Quality Units per Year \ 1.00 1,000 200 2.00 800 400 3.00 600 600 4.00 400 800 5.00 200 1,000
-In a free market economy,the market clearing (equilibrium)price in the above table would adjust to
(Multiple Choice)
4.9/5 (39)
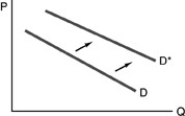 -Refer to the above figure.For a normal good,the rightward shift of the curve could have been caused by
(Multiple Choice)
4.9/5 (39)
In general,any ceteris paribus determinant of supply that is favorable to production will
(Multiple Choice)
4.9/5 (44)
If we are comparing the price of regular gasoline with the price of super gasoline,then an increase in the relative price of regular gasoline implies that
(Multiple Choice)
4.8/5 (34)
How does a change in quantity supplied differ from a change in supply?
(Multiple Choice)
4.8/5 (37)
When there is a shortage,
I.there is a tendency for price to increase.
II.there is an excess quantity demanded.
(Multiple Choice)
4.8/5 (36)
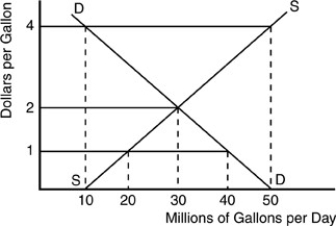 -According to the above figure for a gasoline market,an increase in the price from $2 to $4 will result in
(Multiple Choice)
4.9/5 (40)
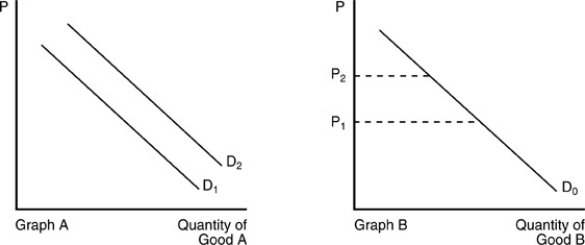 -In the above figure,the demand curve for Good A shifts from D1 to D2 in Graph A when the price of Good B changes from P1 to P2 in Graph B.We can conclude that
(Multiple Choice)
4.9/5 (34)
Given a market equilibrium point,explain,using the concepts of demand and supply,how it is achieved.
(Essay)
4.9/5 (43)
The price of a first-class stamp in 1957 was 3 cents,and it is 45 cents in 2012.From this we know that
(Multiple Choice)
4.8/5 (36)
Filters
- Essay(0)
- Multiple Choice(0)
- Short Answer(0)
- True False(0)
- Matching(0)