Exam 3: Demand and Supply
Exam 1: The Nature of Economics347 Questions
Exam 2: Scarcity and the World of Trade-Offs411 Questions
Exam 3: Demand and Supply448 Questions
Exam 3: Extensions of Demand and Supply Analysis399 Questions
Exam 4: Public Spending and Public Choice346 Questions
Exam 5: Funding the Public Sector202 Questions
Exam 6: Demand and Supply Elasticity413 Questions
Exam 7: Consumer Choice458 Questions
Exam 8: Rents, profits, and the Financial Environment of Business445 Questions
Exam 9: The Firm: Cost and Output Determination387 Questions
Exam 10: Perfect Competition431 Questions
Exam 11: Monopoly386 Questions
Exam 12: Monopolistic Competition309 Questions
Exam 13: Oligopoly and Strategic Behavior307 Questions
Exam 14: Regulation and Antitrust Policy in a Globalized Economy309 Questions
Exam 15: The Labor Market: Demand, supply and Outsourcing376 Questions
Exam 16: Unions and Labor Market Monopoly Power318 Questions
Exam 17: Income, poverty, and Health Care302 Questions
Exam 18: Environmental Economics300 Questions
Exam 19: Comparative Advantage and the Open Economy314 Questions
Exam 20: Exchange Rates and the Balance of Payments300 Questions
Select questions type
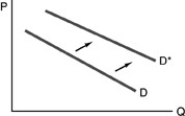 -Refer to the above figure.The arrows show the direction of a shift in the demand curve of Good A.Which of the following would be the most likely reason for the shift in the demand curve if Good A is an inferior good?
(Multiple Choice)
4.9/5  (35)
(35)
The price of a new car is $40,000 while the price of a five-year old car of the same brand is $16,000.The next year the price of the new car increases to $44,000 and the price of a five-year old car of the same brand is $17,600.The relative price of the used car
(Multiple Choice)
5.0/5 (38)
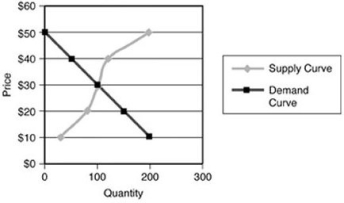 -In the above figure,what would result if the price was $40?
(Multiple Choice)
4.9/5 (41)
Distinguish between a change in demand and a change in quantity demanded.
(Essay)
4.9/5 (39)
Which of the following will cause a rightward shift of the demand curve?
(Multiple Choice)
4.9/5 (33)
The price of a new textbook is $120 in one year and is $150 two years later,while the price of a used copy of the text increased from $40 to $60.The relative price of a new textbook
(Multiple Choice)
4.8/5 (31)
When income increases,the demand curve for an inferior good
(Multiple Choice)
4.9/5 (44)
If the government imposes a per-unit tax on sales of an industry's product,then we would expect
(Multiple Choice)
4.9/5 (38)
There is a 15 percent increase in the price of lumber used by a firm that builds new homes.This causes
(Multiple Choice)
5.0/5 (36)
Suppose a college increases the wages paid to student employees.Which of the following options is the best description of the most likely effect of the increase in wage earnings on the demand curve for school sweatshirts in the bookstore?
(Multiple Choice)
4.9/5 (35)
Suppose a shortage for good X exists.Given this information,we know that
(Multiple Choice)
4.9/5 (40)
Price per Constant Quality of X Quantity of X Demanded per Time Period Quantity of X Supplied per Time Period \ 10 0 150 8 20 120 6 40 90 4 60 60 2 80 30 0 100 0
-According to the market data for good X in the above table,a stable equilibrium price is established at
(Multiple Choice)
4.8/5 (42)
Filters
- Essay(0)
- Multiple Choice(0)
- Short Answer(0)
- True False(0)
- Matching(0)