Exam 9: The Firm: Cost and Output Determination
Exam 1: The Nature of Economics347 Questions
Exam 2: Scarcity and the World of Trade-Offs411 Questions
Exam 3: Demand and Supply448 Questions
Exam 3: Extensions of Demand and Supply Analysis399 Questions
Exam 4: Public Spending and Public Choice346 Questions
Exam 5: Funding the Public Sector202 Questions
Exam 6: Demand and Supply Elasticity413 Questions
Exam 7: Consumer Choice458 Questions
Exam 8: Rents, profits, and the Financial Environment of Business445 Questions
Exam 9: The Firm: Cost and Output Determination387 Questions
Exam 10: Perfect Competition431 Questions
Exam 11: Monopoly386 Questions
Exam 12: Monopolistic Competition309 Questions
Exam 13: Oligopoly and Strategic Behavior307 Questions
Exam 14: Regulation and Antitrust Policy in a Globalized Economy309 Questions
Exam 15: The Labor Market: Demand, supply and Outsourcing376 Questions
Exam 16: Unions and Labor Market Monopoly Power318 Questions
Exam 17: Income, poverty, and Health Care302 Questions
Exam 18: Environmental Economics300 Questions
Exam 19: Comparative Advantage and the Open Economy314 Questions
Exam 20: Exchange Rates and the Balance of Payments300 Questions
Select questions type
If,in the short run,the level of output is zero,which of the following statement is true?
(Multiple Choice)
4.8/5  (32)
(32)
Input of Labor (no. of workers in weeks) Total Product (no. of snowboards produced) 0 0 1 30 2 68 3 110 4 140 5 135
-In the above table,how many workers are employed when marginal product reaches its maximum?
(Multiple Choice)
4.9/5 (33)
What are the relationships between the marginal cost curve and the average cost curves? Explain in words.
(Essay)
4.8/5 (35)
Suppose that when the level of output for the firm increases from 100 to 110 units,its variable costs increase from $500 to $700.What is the firm's marginal cost?
(Multiple Choice)
4.8/5 (27)
Which of the following statements with respect to the figure below is INCORRECT? 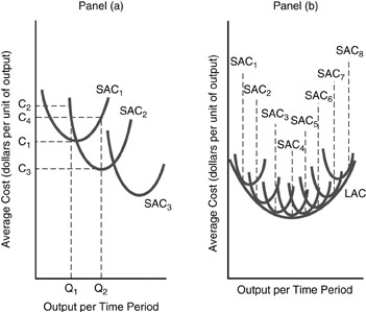
(Multiple Choice)
4.8/5 (37)
Labor Output Average Physical Product Marginal Product 1 10 - 2 12 3 15 4 52 5 9
-Using the above table,the total product and average physical product when 3 workers are employed are
(Multiple Choice)
4.9/5 (33)
Output Fixed Costs Variable Costs Total Costs Average Total Costs Average Variable Costs Marginal Costs 0 \ 0 \ 100 1 30 2 50 3 60 4 120 5 200
-In the above table,what is the average variable cost to produce 3 units of output?
(Multiple Choice)
4.8/5 (27)
A decrease in the long-run average costs resulting from increasing output is referred to as
(Multiple Choice)
4.8/5 (38)
Quantity of Labor Total Product Average Product Marginal Product 1 22 22 22 2 52 26 30 3 81 27 29 4 100 25 19 5 115 23 15 6 126 21 11
-Refer to the above table.At what quantity of labor does the marginal cost curve start to increase?
(Multiple Choice)
4.8/5 (35)
Explain how you can calculate average physical product and marginal physical product from information on total physical product and variable input.
(Essay)
4.8/5 (41)
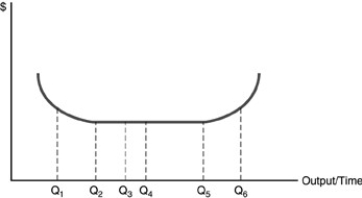 -Refer to the above figure.Minimum efficient scale is at output rate
(Multiple Choice)
5.0/5 (33)
Q (output) TFC TVC TC AFC AVC ATC MC 0 \ 0 - - - - 1 \ 10 2 \ 5 \ 15 3 \ 15 4 \1 6.75
-Using the above table,the TVC,the TC,and MC when output is 3 units are
(Multiple Choice)
4.8/5 (36)
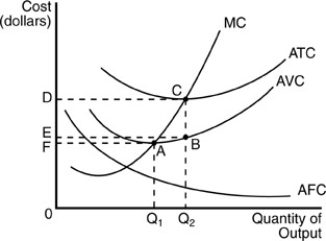 -In the above figure,if this firm produces output level Q2,it has average variable costs of
(Multiple Choice)
4.8/5 (31)
Q TFC TVC TC AFC AVC ATC 1 2 \ 75 \ 25 3 \ 40
-Refer to the above table.What are total fixed costs at an output of 3 units?
(Multiple Choice)
4.9/5 (32)
The ratio of total costs to the quantity produced is referred to as
(Multiple Choice)
4.9/5 (40)
Filters
- Essay(0)
- Multiple Choice(0)
- Short Answer(0)
- True False(0)
- Matching(0)