Exam 3: Numerical Descriptive Measures
Exam 1: Introduction and Data Collection131 Questions
Exam 2: Presenting Data in Tables and Charts178 Questions
Exam 3: Numerical Descriptive Measures148 Questions
Exam 4: Basic Probability146 Questions
Exam 5: Some Important Discrete Probability Distributions169 Questions
Exam 6: The Normal Distribution and Other Continuous Distributions187 Questions
Exam 7: Sampling Distributions183 Questions
Exam 8: Confidence Interval Estimation176 Questions
Exam 9: Fundamentals of Hypothesis Testing: One-Sample Tests167 Questions
Exam 10: Hypothesis Testing: Two Sample Tests160 Questions
Exam 11: Analysis of Variance141 Questions
Exam 12: Simple Linear Regression196 Questions
Exam 13: Introduction to Multiple Regression256 Questions
Exam 14: Time-Series Forecasting and Index Numbers203 Questions
Exam 15: Chi-Square Tests135 Questions
Exam 16: Multiple Regression Model Building92 Questions
Exam 17: Decision Making111 Questions
Exam 18: Statistical Applications in Quality and Productivity Management127 Questions
Exam 19: Further Non-Parametric Tests51 Questions
Select questions type
Instruction 3-3
The stem-and-leaf display below represents the number of vitamin supplements sold by a health food store in a sample of 16 days.
Stem Leaves 1 99 2 0023 2 567 3 034 3 568 4 1 Note (1): 1H means the "high teens" = 15,16,17,18,or 19;2L means the "low twenties" = 20,21,22,23,or 24;2H means the "high twenties" = 25,26,27,28,or 29,etc.
Note (2): For this sample,the sum of the observations is 448,the sum of the squares of the observations is 13,356,and the sum of the squared differences between each observation and the mean is 812.
-Referring to Instruction 3-3,the range of the number of vitamin supplements sold in this sample is ________.
(Short Answer)
4.7/5  (40)
(40)
If a set of data is perfectly symmetrical,the arithmetic mean must be identical to the median.
(True/False)
4.9/5 (36)
Instruction 3-9
Given below are the rating and performance scores of 15 laptop computers.
Performance 115 191 153 194 236 184 184 216 185 183 189 202 192 141 Overall 74 78 79 80 84 76 77 92 83 78 77 78 78 73 Rating
-Referring to Instruction 3-9,what is the sample covariance between the performance scores and the rating?
(Short Answer)
4.8/5 (34)
Which of the following is NOT sensitive to extreme values?
(Multiple Choice)
4.7/5 (36)
Instruction 3-3
The stem-and-leaf display below represents the number of vitamin supplements sold by a health food store in a sample of 16 days.
Stem Leaves 1 99 2 0023 2 567 3 034 3 568 4 1 Note (1): 1H means the "high teens" = 15,16,17,18,or 19;2L means the "low twenties" = 20,21,22,23,or 24;2H means the "high twenties" = 25,26,27,28,or 29,etc.
Note (2): For this sample,the sum of the observations is 448,the sum of the squares of the observations is 13,356,and the sum of the squared differences between each observation and the mean is 812.
-Referring to Instruction 3-3,the standard deviation of the number of vitamin supplements sold in this sample is ________.
(Short Answer)
4.8/5 (46)
The larger the Z score,the further is the distance from the observation to the median.
(True/False)
4.8/5 (39)
Instruction 3-2
The data below represents the amount of grams of carbohydrates in a serving of breakfast cereal in a sample of 11 different servings.
-Referring to Instruction 3-2,the standard deviation of the carbohydrate amounts is ________ grams.
(Short Answer)
4.8/5 (38)
A manufacturer of flashlight batteries took a sample of 130 batteries from a day's production and used them continuously until they were drained.The number of hours until failure were recorded.Given below is the boxplot of the number of hours it took to drain each of the 130 batteries.The distribution of the number of hours is 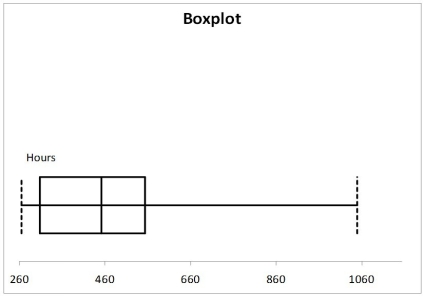
(Multiple Choice)
4.8/5 (43)
In a perfectly symmetrical bell-shaped "normal" distribution
(Multiple Choice)
4.9/5 (39)
Instruction 3-8
Given below is the frequency distribution of the number of defective tomatoes in 50 different shipments.
Defective Items Frequency 0 but less than 5 35 5 but less than 10 7 10 but less than 15 5 15 but less than 20 2 20 but less than 25 1 25 but less than 30 0
-Referring to Instruction 3-8,what is the approximate variance?
(Short Answer)
4.7/5 (38)
Instruction 3-7
Given below is the frequency distribution of the 12-month rate of return achieved by 30 stocks.
12-month Rate of Return Number of Funds -0.10 but less than 0.0 3 0.0 but less than 0.1 5 0.1 but less than 0.2 6 0.2 but less than 0.3 10 0.3 but less than 0.4 6
-Referring to Instruction 3-7,what is the approximate variance?
(Short Answer)
4.9/5 (28)
The geometric mean is a measure of variation or dispersion in a set of data.
(True/False)
4.9/5 (34)
Instruction 3-2
The data below represents the amount of grams of carbohydrates in a serving of breakfast cereal in a sample of 11 different servings.
-Referring to Instruction 3-2,the median carbohydrate amount in the cereal is ________ grams.
(Short Answer)
4.8/5 (32)
Instruction 3-5
The rate of return of a listed Australian company over the past 15 years are:
3.17%,4.43%,5.93%,5.43%,7.29%,8.21%,6.23%,5.23%,4.34%,6.68%,7.14%,-5.56%,-5.23%,-5.73%,-10.34%.
-Referring to Instruction 3-5,compute the geometric mean rate of return.
(Short Answer)
4.8/5 (32)
Instruction 3-4
The ordered array below represents the number of cargo manifests approved by customs inspectors at the Port
of Brisbane in a sample of 35 days.
16,17,18,18,19,20,20,21,21,21,22,22,22,22,23,23,23,23,24,24,24,25,25,26,26,26,27,28,28,29,29,31,31,32,32
Note: For this sample,the sum of the observations is 838,the sum of the squares of the observations is 20,684,
and the sum of the squared differences between each observation and the mean is 619.89.
-Referring to Instruction 3-4,the first quartile of the customs data is ________.
(Short Answer)
4.7/5 (42)
Instruction 3-4
The ordered array below represents the number of cargo manifests approved by customs inspectors at the Port
of Brisbane in a sample of 35 days.
16,17,18,18,19,20,20,21,21,21,22,22,22,22,23,23,23,23,24,24,24,25,25,26,26,26,27,28,28,29,29,31,31,32,32
Note: For this sample,the sum of the observations is 838,the sum of the squares of the observations is 20,684,
and the sum of the squared differences between each observation and the mean is 619.89.
-Referring to Instruction 3-4,the standard deviation of the customs data is ________.
(Short Answer)
4.9/5 (40)
Instruction 3-1
Health care issues are receiving much attention in both academic and political arenas.A sociologist recently conducted a survey of citizens over 60 years of age who have no private health insurance.The ages of 25 uninsured senior citizens were as follows:
60 61 62 63 64 65 66 68 68 69 70 73 73 74 75 76 76 81 81 82 86 87 89 90 92
-Referring to Instruction 3-1,identify the median age of the uninsured senior citizens.
(Short Answer)
4.7/5 (28)
The 12-month rate of returns over a nine year period of a particular stock is 0.099,-0.289,0.089,0.226,0.041,0.161,0.064,-0.029 and 0.022.The geometric mean rate of return for this stock is ________.
(Short Answer)
4.9/5 (38)
As long as your analysis is objective,the interpretation of the data will also be objective.
(True/False)
4.9/5 (39)
Instruction 3-1
Health care issues are receiving much attention in both academic and political arenas.A sociologist recently conducted a survey of citizens over 60 years of age who have no private health insurance.The ages of 25 uninsured senior citizens were as follows:
60 61 62 63 64 65 66 68 68 69 70 73 73 74 75 76 76 81 81 82 86 87 89 90 92
-Referring to Instruction 3-1,calculate the coefficient of variation of the ages of the uninsured senior citizens.
(Short Answer)
4.9/5 (34)
Filters
- Essay(0)
- Multiple Choice(0)
- Short Answer(0)
- True False(0)
- Matching(0)