Exam 2: The Economic Problem: Scarcity and Choice
Exam 1: The Scope and Method of Economics120 Questions
Exam 2: The Economic Problem: Scarcity and Choice110 Questions
Exam 3: Demand, Supply, and Market Equilibrium144 Questions
Exam 4: Demand and Supply Applications86 Questions
Exam 5: Elasticity86 Questions
Exam 6: Household Behavior and Consumer Choice137 Questions
Exam 7: The Production Process: the Behavior of Profit-Maximizing Firms144 Questions
Exam 8: Short-Run Costs and Output Decisions196 Questions
Exam 9: Long-Run Costs and Output Decisions187 Questions
Exam 10: Input Demand: the Labor and Land Markets123 Questions
Exam 11: Input Demand: the Capital Market and the Investment Decision116 Questions
Exam 12: General Equilibrium and the Efficiency of Perfect Competition99 Questions
Exam 13: Monopoly and Antitrust Policy200 Questions
Exam 14: Oligopoly110 Questions
Exam 15: Monopolistic Competition118 Questions
Exam 16: Externalities, Public Goods, and Social Choice170 Questions
Exam 17: Uncertainty and Asymmetric Information66 Questions
Exam 18: Income Distribution and Poverty143 Questions
Exam 19: Public Finance: The Economics of Taxation136 Questions
Exam 20: International Trade, Comparative Advantage, and Protectionism151 Questions
Exam 21: Economic Growth in Developing and Transitional Economies105 Questions
Select questions type
Refer to the information provided in Figure 2.6 below to answer the questions that follow. 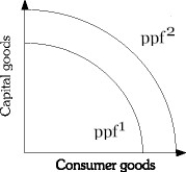 Figure 2.6
-Refer to Figure 2.6. Economic growth is represented by a
Figure 2.6
-Refer to Figure 2.6. Economic growth is represented by a
(Multiple Choice)
5.0/5  (30)
(30)
Related to the Economics in Practice on page 39: In the survey conducted by Esther Duflo and Abhijit Banerjee, the extremely poor were found to consume ________ of their budgets on food compared to people in the United States.
(Multiple Choice)
4.9/5 (37)
The concept of opportunity cost is based on the principle of
(Multiple Choice)
4.9/5 (38)
A society's production possibility frontier is bowed in from the origin due to specialized resources.
(True/False)
4.9/5 (38)
Refer to the information provided in Figure 2.5 below to answer the questions that follow. 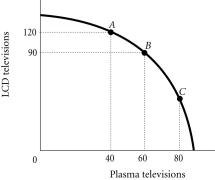 Figure 2.5
-Refer to Figure 2.5. The economy is currently at Point A. The opportunity cost of moving from Point A to Point B is the
Figure 2.5
-Refer to Figure 2.5. The economy is currently at Point A. The opportunity cost of moving from Point A to Point B is the
(Multiple Choice)
4.8/5 (41)
The idea that consumers ultimately dictate what will be produced by choosing what to purchase is known as
(Multiple Choice)
4.9/5 (41)
The government produces only what the market is willing to pay for.
(True/False)
5.0/5 (41)
Refer to the information provided in Figure 2.1 below to answer the questions that follow. 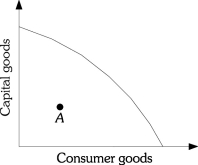 Figure 2.1
-Refer to Figure 2.1. The shape of Macroland's production possibility frontier shows
Figure 2.1
-Refer to Figure 2.1. The shape of Macroland's production possibility frontier shows
(Multiple Choice)
4.9/5 (37)
Refer to the information provided in Figure 2.4 below to answer the questions that follow. 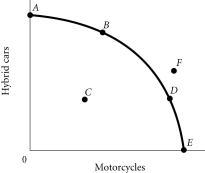 Figure 2.4
-According to Figure 2.4, which point cannot be produced with the current state of technology?
Figure 2.4
-According to Figure 2.4, which point cannot be produced with the current state of technology?
(Multiple Choice)
4.8/5 (36)
Which of the following statements is NOT true for a command economy?
(Multiple Choice)
4.8/5 (32)
Which of the following does NOT constitute an act of "investment" as economists use the term?
(Multiple Choice)
4.8/5 (34)
An economy in which individual people and firms pursue their own self-interest without any central direction or regulation is a(n)
(Multiple Choice)
4.9/5 (39)
Related to the Economics in Practice on page 28: How did the introduction of the microwave in 1960 affect the market for frozen food?
(Multiple Choice)
4.9/5 (39)
Someone has a comparative advantage in producing a good if they can produce that good
(Multiple Choice)
4.7/5 (36)
The process by which resources are transformed into useful forms is
(Multiple Choice)
4.8/5 (44)
Refer to the information provided in Figure 2.4 below to answer the questions that follow. Figure 2.4
-Refer to Figure 2.4. The economy moves from Point A to Point D. This could be explained by
(Multiple Choice)
4.8/5 (31)
Refer to the information provided in Figure 2.3 below to answer the questions that follow. 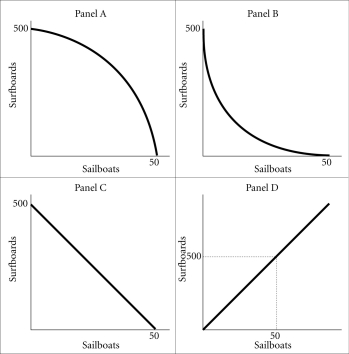 Figure 2.3
-Refer to Figure 2.3. Assume that in this society the opportunity cost of sailboats in terms of surfboards is increasing. A graph of this society's production possibility frontier will be represented by
Figure 2.3
-Refer to Figure 2.3. Assume that in this society the opportunity cost of sailboats in terms of surfboards is increasing. A graph of this society's production possibility frontier will be represented by
(Multiple Choice)
4.8/5 (39)
Filters
- Essay(0)
- Multiple Choice(0)
- Short Answer(0)
- True False(0)
- Matching(0)