Exam 12: Consumption, Real GDP, and the Multiplier
Exam 1: The Nature of Economics348 Questions
Exam 2: Scarcity and the World of Trade-Offs411 Questions
Exam 3: Demand and Supply451 Questions
Exam 4: Extensions of Demand and Supply Analysis401 Questions
Exam 5: Public Spending and Public Choice362 Questions
Exam 6: Funding the Public Sector201 Questions
Exam 7: The Macroeconomy: Unemployment, Inflation, and Deflation413 Questions
Exam 8: Measuring the Economys Performance416 Questions
Exam 9: Global Economic Growth and Development290 Questions
Exam 10: Real GDP and the Price Level in the Long Run298 Questions
Exam 11: Classical and Keynesian Macro Analyses368 Questions
Exam 12: Consumption, Real GDP, and the Multiplier452 Questions
Exam 13: Fiscal Policy274 Questions
Exam 14: Deficit Spending and the Public Debt146 Questions
Exam 15: Money, Banking, and Central Banking516 Questions
Exam 16: Domestic and International Dimensions of Monetary Policy357 Questions
Exam 17: Stabilization in an Integrated World Economy321 Questions
Exam 18: Policies and Prospects for Global Economic Growth228 Questions
Exam 19: Demand and Supply Elasticity412 Questions
Exam 20: Consumer Choice459 Questions
Exam 21: Rents, Profits, and the Financial Environment of Business445 Questions
Exam 22: The Firm: Cost and Output Determination391 Questions
Exam 23: Perfect Competition432 Questions
Exam 24: Monopoly386 Questions
Exam 25: Monopolistic Competition307 Questions
Exam 26: Oligopoly and Strategic Behavior308 Questions
Exam 27: Regulation and Antitrust Policy in a Globalized Economy310 Questions
Exam 28: The Labor Market: Demand, Supply and Outsourcing376 Questions
Exam 29: Unions and Labor Market Monopoly Power319 Questions
Exam 30: Income, Poverty, and Health Care304 Questions
Exam 31: Environmental Economics299 Questions
Exam 32: Comparative Advantage and the Open Economy282 Questions
Exam 33: Exchange Rates and the Balance of Payments285 Questions
Select questions type
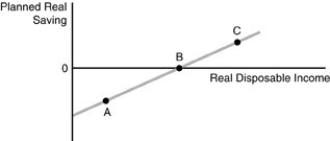 -Refer to the above figure. The figure represents the saving function for the consumer. Point C represents
(Multiple Choice)
4.9/5  (39)
(39)
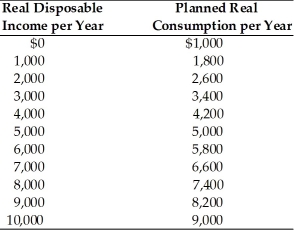 -In the above table, the average propensity to save when disposable income is $5,000 is
(Multiple Choice)
4.8/5 (30)
If the marginal propensity to consume (MPC) is 0.8 and there is a desire to increase real GDP by $400 billion, then
(Multiple Choice)
4.8/5 (38)
If the multiplier is 50, then the marginal propensity to consume (MPC) is
(Multiple Choice)
5.0/5 (45)
Suppose autonomous consumption is $1 trillion, investment spending is $1.5 trillion, and the marginal propensity to consume is 0.75. Show the graph for the C + I curve. What is the equilibrium level of real GDP? Explain its meaning.
(Essay)
4.7/5 (39)
Your real disposable income is your real income after you have paid
(Multiple Choice)
4.8/5 (36)
The marginal propensity to consume (MPC) can best be defined as that fraction of
(Multiple Choice)
4.8/5 (38)
Which of the following theories predicts that current consumption increases when a person expects an increase in future income?
(Multiple Choice)
4.9/5 (37)
When the economy is operating at the equilibrium level of GDP, we know that
(Multiple Choice)
4.7/5 (44)
Suppose the marginal propensity to consume (MPC) is 0.8 and there is a $1,000 increase in autonomous consumption. Given this information, real GDP will increase by
(Multiple Choice)
4.9/5 (28)
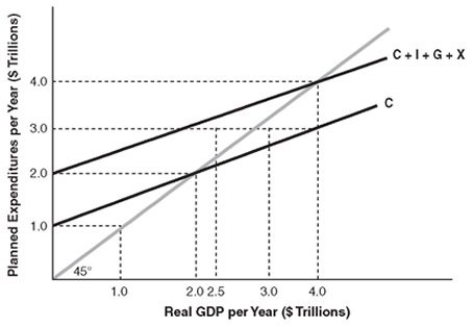 -In the above figure, the equilibrium level of planned saving plus net taxes is
(Multiple Choice)
4.9/5 (35)
 -In the above table, saving equals zero when real disposable income equals
(Multiple Choice)
4.9/5 (27)
Spending on new goods and services out of a household's current income is
(Multiple Choice)
4.9/5 (31)
Filters
- Essay(0)
- Multiple Choice(0)
- Short Answer(0)
- True False(0)
- Matching(0)