Exam 12: Consumption, Real GDP, and the Multiplier
Exam 1: The Nature of Economics348 Questions
Exam 2: Scarcity and the World of Trade-Offs411 Questions
Exam 3: Demand and Supply451 Questions
Exam 4: Extensions of Demand and Supply Analysis401 Questions
Exam 5: Public Spending and Public Choice362 Questions
Exam 6: Funding the Public Sector201 Questions
Exam 7: The Macroeconomy: Unemployment, Inflation, and Deflation413 Questions
Exam 8: Measuring the Economys Performance416 Questions
Exam 9: Global Economic Growth and Development290 Questions
Exam 10: Real GDP and the Price Level in the Long Run298 Questions
Exam 11: Classical and Keynesian Macro Analyses368 Questions
Exam 12: Consumption, Real GDP, and the Multiplier452 Questions
Exam 13: Fiscal Policy274 Questions
Exam 14: Deficit Spending and the Public Debt146 Questions
Exam 15: Money, Banking, and Central Banking516 Questions
Exam 16: Domestic and International Dimensions of Monetary Policy357 Questions
Exam 17: Stabilization in an Integrated World Economy321 Questions
Exam 18: Policies and Prospects for Global Economic Growth228 Questions
Exam 19: Demand and Supply Elasticity412 Questions
Exam 20: Consumer Choice459 Questions
Exam 21: Rents, Profits, and the Financial Environment of Business445 Questions
Exam 22: The Firm: Cost and Output Determination391 Questions
Exam 23: Perfect Competition432 Questions
Exam 24: Monopoly386 Questions
Exam 25: Monopolistic Competition307 Questions
Exam 26: Oligopoly and Strategic Behavior308 Questions
Exam 27: Regulation and Antitrust Policy in a Globalized Economy310 Questions
Exam 28: The Labor Market: Demand, Supply and Outsourcing376 Questions
Exam 29: Unions and Labor Market Monopoly Power319 Questions
Exam 30: Income, Poverty, and Health Care304 Questions
Exam 31: Environmental Economics299 Questions
Exam 32: Comparative Advantage and the Open Economy282 Questions
Exam 33: Exchange Rates and the Balance of Payments285 Questions
Select questions type
Explain how the aggregate demand curve is related to the C + I + G + X curve.
(Essay)
4.9/5  (44)
(44)
When the equilibrium price level adjusts to an increase in autonomous investment spending, the impact of the multiplier effect resulting from that spending increase
(Multiple Choice)
4.7/5 (26)
When graphing the consumption function, what purpose is served by the 45-degree line?
(Multiple Choice)
4.8/5 (47)
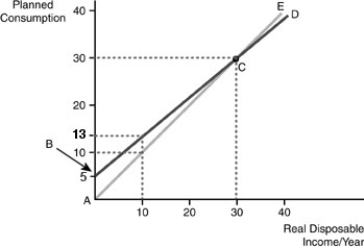
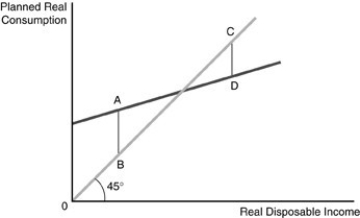 -Refer to the above figure. The figure represents the consumption function for a consumer. The distance between C and D represents
(Multiple Choice)
4.9/5 (33)
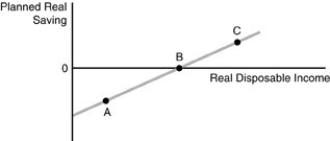 -Refer to the above figure. The figure represents the saving function for the consumer. Point A represents
(Multiple Choice)
4.9/5 (33)
Suppose marginal propensity to consume (MPC) is 0.7 and there is a $100 increase in autonomous consumption. Given this information, real GDP will increase by
(Multiple Choice)
4.9/5 (35)
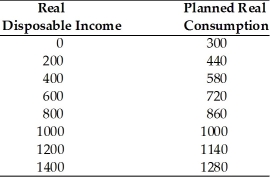 -Refer to the above table. The table gives the combinations of real disposable income and real consumption for a college student for a year. What is the value of the marginal propensity to consume?
(Multiple Choice)
4.9/5 (35)
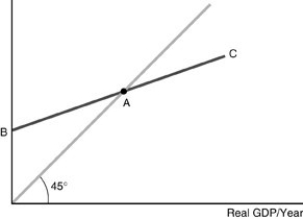 -The above figure shows a consumption function and a 45-degree line. Real consumption is a function of disposable income. Why is real GDP used here instead? What is measured along the vertical axis? What is measured by point B? Explain the significance of point A.
(Essay)
4.8/5 (37)
Suppose that there is no government and no international trade. When C + I is less than the level of real GDP
(Multiple Choice)
4.8/5 (36)
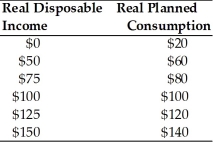 -Use the above table. Dissaving occurs up to a disposable income level of
(Multiple Choice)
4.8/5 (29)
Ignoring the government and foreign sectors, if planned investment spending is $50 billion, planned saving is $80 billion, and real Gross Domestic Product (GDP) is $130 billion, then unplanned inventories will
(Multiple Choice)
4.8/5 (41)
The ratio of the change in consumption to the change in disposable income is the
(Multiple Choice)
4.8/5 (34)
Thinking as an economist would, which is TRUE of investment?
(Multiple Choice)
4.9/5 (33)
 -Refer to the above figure. The marginal propensity to consume and the marginal propensity to save
(Multiple Choice)
4.8/5 (35)
If the multiplier is 2, the marginal propensity to consume (MPC) must be
(Multiple Choice)
4.8/5 (35)
Filters
- Essay(0)
- Multiple Choice(0)
- Short Answer(0)
- True False(0)
- Matching(0)