Exam 10: Real GDP and the Price Level in the Long Run
Exam 1: The Nature of Economics348 Questions
Exam 2: Scarcity and the World of Trade-Offs411 Questions
Exam 3: Demand and Supply451 Questions
Exam 4: Extensions of Demand and Supply Analysis401 Questions
Exam 5: Public Spending and Public Choice362 Questions
Exam 6: Funding the Public Sector201 Questions
Exam 7: The Macroeconomy: Unemployment, Inflation, and Deflation413 Questions
Exam 8: Measuring the Economys Performance416 Questions
Exam 9: Global Economic Growth and Development290 Questions
Exam 10: Real GDP and the Price Level in the Long Run298 Questions
Exam 11: Classical and Keynesian Macro Analyses368 Questions
Exam 12: Consumption, Real GDP, and the Multiplier452 Questions
Exam 13: Fiscal Policy274 Questions
Exam 14: Deficit Spending and the Public Debt146 Questions
Exam 15: Money, Banking, and Central Banking516 Questions
Exam 16: Domestic and International Dimensions of Monetary Policy357 Questions
Exam 17: Stabilization in an Integrated World Economy321 Questions
Exam 18: Policies and Prospects for Global Economic Growth228 Questions
Exam 19: Demand and Supply Elasticity412 Questions
Exam 20: Consumer Choice459 Questions
Exam 21: Rents, Profits, and the Financial Environment of Business445 Questions
Exam 22: The Firm: Cost and Output Determination391 Questions
Exam 23: Perfect Competition432 Questions
Exam 24: Monopoly386 Questions
Exam 25: Monopolistic Competition307 Questions
Exam 26: Oligopoly and Strategic Behavior308 Questions
Exam 27: Regulation and Antitrust Policy in a Globalized Economy310 Questions
Exam 28: The Labor Market: Demand, Supply and Outsourcing376 Questions
Exam 29: Unions and Labor Market Monopoly Power319 Questions
Exam 30: Income, Poverty, and Health Care304 Questions
Exam 31: Environmental Economics299 Questions
Exam 32: Comparative Advantage and the Open Economy282 Questions
Exam 33: Exchange Rates and the Balance of Payments285 Questions
Select questions type
What has been TRUE about inflation in the United States since 1960?
(Multiple Choice)
4.7/5  (32)
(32)
One reason that the aggregate demand curve slopes downward is because
(Multiple Choice)
4.8/5 (40)
Suppose that along the aggregate demand curve, real GDP equals $15 trillion when the GDP deflator is 90. If the GDP deflator were 95, real GDP along the aggregate demand curve would equal
(Multiple Choice)
4.9/5 (31)
What causes the long-run aggregate supply curve to shift right?
(Multiple Choice)
4.9/5 (32)
When the aggregate demand curve shifts ________ than the long-run aggregate supply shifts leftward, the result will be inflation.
(Multiple Choice)
4.8/5 (28)
When expenditures change due to changes in the real value of money caused by variations in the price level, this is known as the
(Multiple Choice)
4.9/5 (38)
Refer to the above figures. Which panel(s) represent the effect of a decrease in labor productivity?
(Multiple Choice)
4.9/5 (34)
A rise in the price level has a direct effect on spending because
(Multiple Choice)
4.8/5 (32)
Which of the following will NOT lead to a rightward shift of the long-run aggregate supply curve?
(Multiple Choice)
4.8/5 (37)
The long-run aggregate supply curve will shift outward to the right when
(Multiple Choice)
4.9/5 (35)
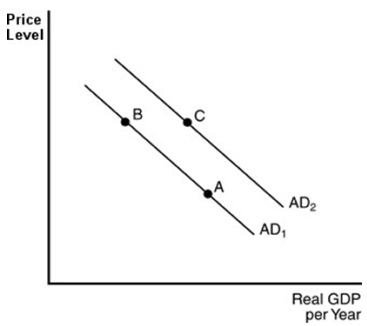 -In the above figure, a movement from point A to point B could be explained by
(Multiple Choice)
4.7/5 (43)
When the relative prices of U.S.-manufactured goods go up, the result is
(Multiple Choice)
4.8/5 (35)
The change in total planned real expenditures resulting from a change in the real value of money balances when the price level changes, all other things held constant, is
(Multiple Choice)
4.7/5 (39)
Filters
- Essay(0)
- Multiple Choice(0)
- Short Answer(0)
- True False(0)
- Matching(0)