Exam 12: The Determination of Aggregate Output, the Price Level, and the Interest Rate
Exam 1: The Scope and Method of Economics120 Questions
Exam 2: The Economic Problem: Scarcity and Choice110 Questions
Exam 3: Demand,supply,and Market Equilibrium144 Questions
Exam 4: Demand and Supply Applications86 Questions
Exam 5: Introduction to Macroeconomics121 Questions
Exam 6: Measuring National Output and National Income146 Questions
Exam 7: Unemployment,inflation,and Long-Run Growth149 Questions
Exam 8: Aggregate Expenditure and Equilibrium Output176 Questions
Exam 9: The Government and Fiscal Policy169 Questions
Exam 10: The Money Supply and the Federal Reserve System144 Questions
Exam 11: Money Demand and the Equilibrium Interest Rate129 Questions
Exam 12: The Determination of Aggregate Output, the Price Level, and the Interest Rate119 Questions
Exam 13: Policy Effects and Costs Shocks in the Asad Model102 Questions
Exam 14: The Labor Market in the Macroeconomy147 Questions
Exam 15: Financial Crises, stabilization, and Deficits129 Questions
Exam 16: Household and Firm Behavior in the Macroeconomy: a Further Look185 Questions
Exam 17: Long-Run Growth93 Questions
Exam 18: Alternative Views in Macroeconomics147 Questions
Exam 19: International Trade, comparative Advantage, and Protectionism151 Questions
Exam 20: Open-Economy Macroeconomics: the Balance of Payments and Exchange Rates160 Questions
Exam 21: Economic Growth in Developing and Transitional Economies105 Questions
Select questions type
Refer to the information provided in Figure 12.5 below to answer the questions that follow.
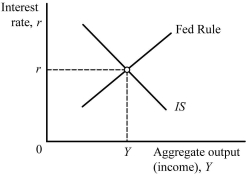 Figure 12.5
-Refer to Figure 12.5.As a result of ________,the equilibrium interest rate increases and the equilibrium output level increases.
Figure 12.5
-Refer to Figure 12.5.As a result of ________,the equilibrium interest rate increases and the equilibrium output level increases.
(Multiple Choice)
4.8/5  (38)
(38)
The Fed is leaning against the wind when it sets a high interest rate during a recession.
(True/False)
4.9/5 (41)
Refer to the information provided in Figure 12.1 below to answer the questions that follow.
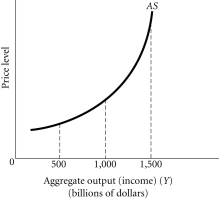 Figure 12.1
-Refer to Figure 12.1.This economy reaches capacity at
Figure 12.1
-Refer to Figure 12.1.This economy reaches capacity at
(Multiple Choice)
4.8/5 (35)
Refer to the information provided in Figure 12.1 below to answer the questions that follow.
Figure 12.1
-Refer to Figure 12.1.At aggregate output levels above $1,500 billion,firms in this economy are most likely experiencing
(Multiple Choice)
4.7/5 (36)
Refer to the information provided in Figure 12.7 below to answer the questions that follow.
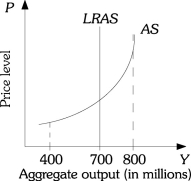 Figure 12.7
-Refer to Figure 12.7.Which of the following statements characterizes an output level of $800 billion?
Figure 12.7
-Refer to Figure 12.7.Which of the following statements characterizes an output level of $800 billion?
(Multiple Choice)
4.9/5 (34)
Potential output is the most that can be produced in an economy at a particular point in time.
(True/False)
4.9/5 (40)
Refer to the information provided in Figure 12.8 below to answer the questions that follow.
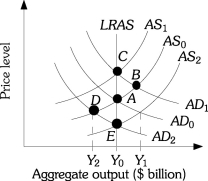 Figure 12.8
-Refer to Figure 12.8.If the economy is currently at Point D producing output level Y2,which of the following is NOT true?
Figure 12.8
-Refer to Figure 12.8.If the economy is currently at Point D producing output level Y2,which of the following is NOT true?
(Multiple Choice)
4.8/5 (36)
Refer to the information provided in Figure 12.1 below to answer the questions that follow.
Figure 12.1
-Refer to Figure 12.1.At aggregate output levels below $500 billion,this economy is most likely experiencing
(Multiple Choice)
4.7/5 (40)
When the aggregate supply curve is vertical,which of the following is NOT true?
(Multiple Choice)
4.9/5 (35)
A decrease in taxes on business investments will increase aggregate supply.
(True/False)
4.8/5 (38)
If there is a decrease in the percentage of employees whose wages adjust automatically with changes in the price level,the aggregate supply curve will become
(Multiple Choice)
4.9/5 (42)
The aggregate demand curve slopes downward because at higher price level
(Multiple Choice)
4.8/5 (35)
Refer to the information provided in Figure 12.2 below to answer the questions that follow.
 Figure 12.2
-Refer to Figure 12.2.Between the output levels of $300 billion and $600 billion,the relationship between the price level and output is
Figure 12.2
-Refer to Figure 12.2.Between the output levels of $300 billion and $600 billion,the relationship between the price level and output is
(Multiple Choice)
4.9/5 (45)
Related to the Economics in Practice on p.554: In the simple "Keynesian" view,maximum output is NOT defined by the
(Multiple Choice)
4.9/5 (31)
The Federal Reserve's policy to "lean against the wind" means that
(Multiple Choice)
4.9/5 (33)
The level of aggregate output that can be sustained in the long run without inflation is known as
(Multiple Choice)
5.0/5 (32)
If government spending increases,then the IS curve shifts to the right.
(True/False)
4.8/5 (42)
Filters
- Essay(0)
- Multiple Choice(0)
- Short Answer(0)
- True False(0)
- Matching(0)