Exam 10: Real GDP and the Price Level in the Long Run
Exam 1: The Nature of Economics347 Questions
Exam 2: Scarcity and the World of Trade-Offs411 Questions
Exam 3: Demand and Supply442 Questions
Exam 4: Extensions of Demand and Supply Analysis399 Questions
Exam 5: Public Spending and Public Choice359 Questions
Exam 6: Funding the Public Sector197 Questions
Exam 7: The Macroeconomy: Unemployment, inflation, and Deflation412 Questions
Exam 8: Measuring the Economys Performance416 Questions
Exam 9: Global Economic Growth and Development282 Questions
Exam 10: Real GDP and the Price Level in the Long Run290 Questions
Exam 11: Classical and Keynesian Macro Analyses365 Questions
Exam 12: Consumption, real GDP, and the Multiplier445 Questions
Exam 13: Fiscal Policy273 Questions
Exam 14: Deficit Spending and the Public Debt145 Questions
Exam 15: Money, banking, and Central Banking517 Questions
Exam 16: Domestic and International Dimensions of Monetary Policy354 Questions
Exam 17: Stabilization in an Integrated World Economy295 Questions
Exam 18: Policies and Prospects for Global Economic Growth216 Questions
Exam 32: Comparative Advantage and the Open Economy279 Questions
Exam 33: Exchange Rates and the Balance of Payments300 Questions
Select questions type
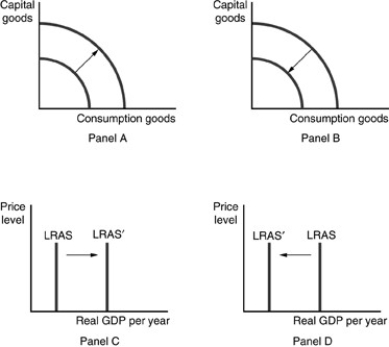 -Refer to the above figures.Which panel(s)represent the effect of a decrease in labor productivity?
(Multiple Choice)
4.9/5  (34)
(34)
Suppose total planned expenditures equal $14.4 trillion when the value of the price level is 95.If the price level dropped to 90,total planned real expenditures will equal
(Multiple Choice)
4.8/5 (28)
All of the following would shift the LRAS curve to the right EXCEPT
(Multiple Choice)
4.8/5 (38)
Over the past several decades,what has been true about inflation in the United States?
(Multiple Choice)
4.8/5 (34)
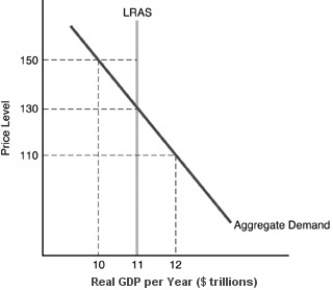 -In the above figure,the long-run equilibrium price level is
(Multiple Choice)
4.8/5 (28)
When the relative prices of U.S.-manufactured goods go up,the result is
(Multiple Choice)
4.7/5 (37)
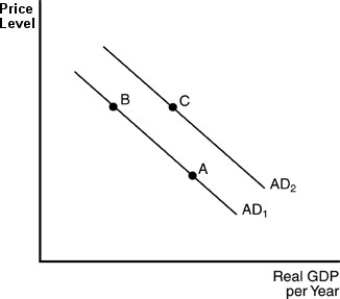 -In the above figure,a movement from point B to point C could be explained by
(Multiple Choice)
4.9/5 (44)
One reason that the aggregate demand curve slopes downward is because
(Multiple Choice)
4.9/5 (24)
An economy experiences real growth over time with stable aggregate demand.This would likely result in
(Multiple Choice)
4.9/5 (33)
According to the real-balance effect,an increase in the price level will
(Multiple Choice)
4.8/5 (31)
Filters
- Essay(0)
- Multiple Choice(0)
- Short Answer(0)
- True False(0)
- Matching(0)