Multiple Choice
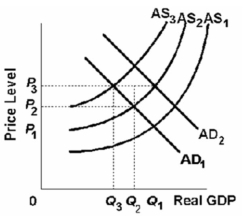
-Refer to the above graph.Given that the economy is at an initial equilibrium where the AD1 and AS1 curves intersect,demand-pull inflation in the short run can best be represented by a shift from:
A) AS1 to AS3.
B) AD1 to AD2.
C) AS1 to AS2.
D) AD2 to AD1.
Correct Answer:

Verified
Correct Answer:
Verified
Q5: <img src="https://d2lvgg3v3hfg70.cloudfront.net/TB2474/.jpg" alt=" -Refer to the
Q6: <img src="https://d2lvgg3v3hfg70.cloudfront.net/TB2474/.jpg" alt=" -Refer to the
Q12: <img src="https://d2lvgg3v3hfg70.cloudfront.net/TB2474/.jpg" alt=" -Refer to the
Q13: <img src="https://d2lvgg3v3hfg70.cloudfront.net/TB2474/.jpg" alt=" -The above diagram
Q14: <img src="https://d2lvgg3v3hfg70.cloudfront.net/TB2474/.jpg" alt=" -Refer to the
Q15: The initial aggregate demand curve is AD<sub>1</sub>
Q20: The short-run aggregate supply curve is upward-sloping
Q40: Prominent supply-side economist Arthur Laffer has argued
Q92: Assuming prices and wages are flexible, a
Q100: The short-run aggregate supply curve is vertical,