Exam 24: Aggregate Demand and Aggregate Supply Analysis
Exam 1: Economics: Foundations and Models447 Questions
Exam 2: Trade-Offs, comparative Advantage, and the Market System492 Questions
Exam 3: Where Prices Come From: the Interaction of Demand and Supply476 Questions
Exam 4: Economic Efficiency, government Price Setting, and Taxes420 Questions
Exam 5: Externalities, environmental Policy, and Public Goods263 Questions
Exam 6: Elasticity: the Responsiveness of Demand and Supply294 Questions
Exam 7: The Economics of Health Care338 Questions
Exam 8: Firms,the Stock Market,and Corporate Governance522 Questions
Exam 9: Comparative Advantage and the Gains From International Trade377 Questions
Exam 10: Consumer Choice and Behavioral Economics300 Questions
Exam 11: Technology,production,and Costs327 Questions
Exam 12: Firms in Perfectly Competitive Markets296 Questions
Exam 13: Monopolistic Competition: the Competitive Model in a More Realistic Setting272 Questions
Exam 14: Oligopoly: Firms in Less Competitive Markets258 Questions
Exam 15: Monopoly and Antitrust Policy279 Questions
Exam 16: Pricing Strategy261 Questions
Exam 17: The Markets for Labor and Other Factors of Production281 Questions
Exam 18: Public Choice, taxes, and the Distribution of Income258 Questions
Exam 19: Gdp: Measuring Total Production and Income261 Questions
Exam 20: Unemployment and Inflation291 Questions
Exam 21: Economic Growth, the Financial System, and Business Cycles253 Questions
Exam 22: Long-Run Economic Growth: Sources and Policies262 Questions
Exam 23: Aggregate Expenditure and Output in the Short Run301 Questions
Exam 24: Aggregate Demand and Aggregate Supply Analysis286 Questions
Exam 25: Money,banks,and the Federal Reserve System281 Questions
Exam 26: Monetary Policy275 Questions
Exam 27: Fiscal Policy306 Questions
Exam 28: Inflation, unemployment, and Federal Reserve Policy257 Questions
Exam 29: Macroeconomics in an Open Economy278 Questions
Exam 30: The International Financial System258 Questions
Select questions type
When the price level rises from 110 to 115,the aggregate level of GDP supplied rises from $80 billion to $120 billion.This ________ relationship represents the ________ relationship between the quantity of real GDP firms are willing to supply and the price level.
(Multiple Choice)
4.8/5  (35)
(35)
A decrease in disposable income will shift the aggregate demand curve to the left.
(True/False)
4.9/5 (38)
Explain how the economy moves back to full employment from recession.Be sure to detail what happens to short-run aggregate supply,unemployment,equilibrium GDP and the price level.
(Essay)
4.9/5 (35)
Which of the following best describes the "interest rate effect"?
(Multiple Choice)
4.9/5 (47)
The impact of Hurricane Katrina on consumers in the economy was to make them very pessimistic about their future incomes.How does this increased pessimism affect the aggregate demand curve?
(Multiple Choice)
4.7/5 (34)
Figure 24-2 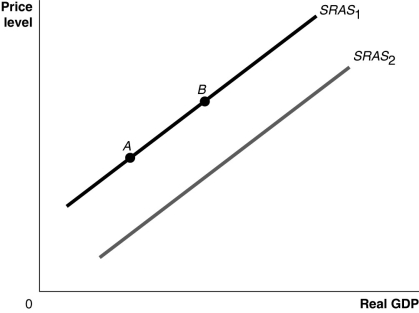 -Refer to Figure 24-2.Ceteris paribus,an increase in workers and firms adjusting to having previously overestimated the price level would be represented by a movement from
(Multiple Choice)
4.9/5 (40)
Which of the following could explain why there is an increase in potential GDP but the equilibrium level of GDP does not rise?
(Multiple Choice)
4.9/5 (31)
Using aggregate demand and aggregate supply,explain what happens in the short run if the Federal Reserve raises interest rates in the economy.Be sure to detail what happens to aggregate demand,the price level,the level of GDP,and unemployment.Assume that the economy is at full employment before the interest rate increase.
(Essay)
4.9/5 (36)
Figure 24-2
-Refer to Figure 24-2.Ceteris paribus,a decrease in the capital stock would be represented by a movement from
(Multiple Choice)
4.9/5 (40)
The long-run adjustment to a negative supply shock results in
(Multiple Choice)
4.9/5 (43)
Figure 24-2
-Refer to Figure 24-2.Ceteris paribus,a decrease in the labor force would be represented by a movement from
(Multiple Choice)
4.9/5 (38)
At the beginning of the recession of 2007-2009,real GDP in the United States was ________ potential GDP,and in June 2009,real GDP was ________ potential GDP.
(Multiple Choice)
4.8/5 (37)
Figure 24-4 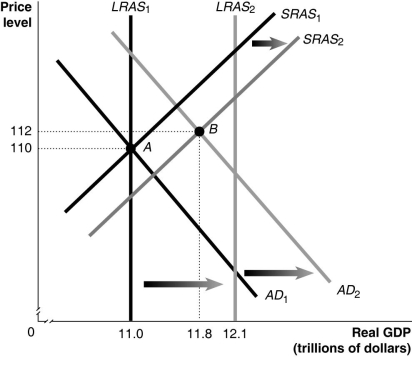 -Refer to Figure 24-4.In the figure above,LRAS1 and SRAS1 denote LRAS and SRAS in year 1,while LRAS2 and SRAS2 denote LRAS and SRAS in year 2.Given the economy is at point A in year 1,what is the growth rate in potential GDP in year 2?
(Multiple Choice)
4.9/5 (30)
Inflation is generally the result of total spending growing faster than total production.
(True/False)
4.8/5 (35)
The dynamic aggregate demand and aggregate supply model assumes that potential GDP increases over time.
(True/False)
4.8/5 (46)
Filters
- Essay(0)
- Multiple Choice(0)
- Short Answer(0)
- True False(0)
- Matching(0)