Exam 14: The Demand and Supply of Resources
Exam 1: The Five Foundations of Economics101 Questions
Exam 2: Model Building and Gains From Trade149 Questions
Exam 3: The Market at Work: Supply and Demand142 Questions
Exam 4: Elasticity141 Questions
Exam 5: Price Controls135 Questions
Exam 6: The Efficiency of Markets and the Costs of Taxation152 Questions
Exam 7: Market Inefficiencies: Externalities and Public Goods145 Questions
Exam 8: Business Costs and Production149 Questions
Exam 9: Firms in a Competitive Market145 Questions
Exam 10: Understanding Monopoly149 Questions
Exam 11: Price Discrimination138 Questions
Exam 12: Monopolistic Competition and Advertising133 Questions
Exam 13: Oligopoly and Strategic Behavior151 Questions
Exam 14: The Demand and Supply of Resources135 Questions
Exam 15: Income, Inequality, and Poverty128 Questions
Exam 16: Consumer Choice127 Questions
Exam 17: Behavioral Economics and Risk Taking134 Questions
Exam 18: Health Insurance and Health Care124 Questions
Select questions type
You know that the rental price of capital is $3,000, the rental price of land is $2,000, and the wage of labor is $100. The value of the marginal product produced by each factor is $30,000, $4,000, and $200, respectively. You would advise the company to hire more:
(Multiple Choice)
4.8/5  (31)
(31)
Refer to the accompanying table to answer the questions. Number of Workers Output 1 20 2 30 3 38 4 42 5 44
-The marginal product of labor of the fourth worker is:
(Multiple Choice)
4.8/5 (30)
Use the accompanying graph, which depicts Mighty Max's labor demand for his duffle-bag business, to answer the questions. 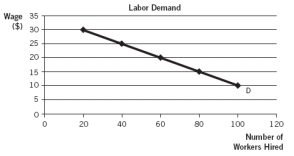 -If 80 workers are hired, you know that the wage rate must be:
(Multiple Choice)
4.8/5 (28)
The labor market for doctors can be represented with the following two equations:
LS =5 + 3W
LD = 30 − 2W
Graph this labor market, highlighting equilibrium wages W* and quantity of labor L*. Label the wages where a shortage and a surplus would exist if the wage deviates from W*.
(Essay)
4.9/5 (43)
Use the accompanying graph, which depicts Mighty Max's labor demand for his duffle-bag business, to answer the questions.
-If the wage is $20, Mighty Max will hire _________ workers.
(Multiple Choice)
4.8/5 (32)
Refer to the accompanying graphs to answer the questions.
Graph A 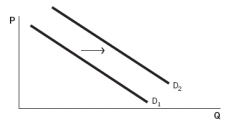 Graph B
 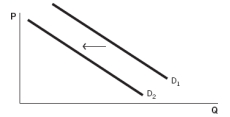 Graph C
 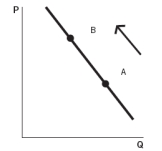 Graph D
 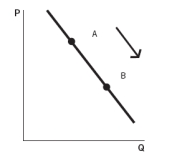 Graph E
 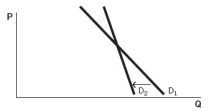 -Choose the graph that represents the following situation: Consumer demand for Patty's Pickles increases as customers find out that pickles are highly nutritious.
(Multiple Choice)
4.9/5 (38)
In theory, some people might lose in the short run from outsourcing, but in the long run, all should benefit. Which option demonstrates that this theory might not be true?
(Multiple Choice)
4.8/5 (39)
The King Kupcake firm's worker productivity is presented in the accompanying table. When King Kupcake hires its 300th worker, what is that worker's marginal product of labor? Quantity of Workers 100 200 300 400 Ouantity of Output 650 950 1,150 1,200
(Multiple Choice)
4.8/5 (35)
The area underneath a firm's labor demand curve and above the market wage is the graphical representation of the firm's:
(Multiple Choice)
4.8/5 (40)
Two events are occurring simultaneously in the labor market for laborers who produce sports apparel. First, the government's campaign to increase the activity rate among its citizens is proving successful, and more people are going to the gym on a regular basis. Second, the sports apparel industry is known for its relatively high pay and good benefits, which are attractive to workers.
a. Graph the effect of each shift separately. Label the original equilibrium wage and quantity W1 and L1, respectively.
b. What needs to be true about the relative size of these shifts if workers in this labor market are to earn higher wages?
(Essay)
4.9/5 (41)
Your sister complains that you get paid considerably more as a caterer than she is paid as a chef, even though the careers are similar. What might explain this situation?
(Multiple Choice)
4.9/5 (47)
Refer to the accompanying graphs to answer the questions.
Graph A Graph B Graph C Graph D Graph E
-Choose the graph that represents the following situation: A documentary on bottled water demonstrates the high impact this product has on the environment. In response, consumers drastically reduce their consumption of this product.
(Multiple Choice)
4.8/5 (38)
You and your friend get into an argument when she finds out that you earn more than she does. She says it isn't fair, but you argue that there are many reasons why you legitimately earn more. Explain two possible reasons in detail.
(Essay)
4.8/5 (45)
When their wages rise, Bob works more and Lisa works less. We can infer that Bob values income _________ than Lisa.
(Multiple Choice)
4.8/5 (37)
Rose travels back in time to deposit $100 in a high-interest-bearing savings account. When she returns to the present, she is a billionaire. We can expect Rose to work ________ hours because of the _________ effect.
(Multiple Choice)
4.8/5 (30)
The total production schedule for greeting card writers is as follows: Quantity of Writers Total Cards 1 50 2 65 3 76 4 86 5 94 6 100
a. Find the marginal product for each additional worker, and graph the marginal product of labor (MPL) curve.
b. Why is the slope of the MPL curve negative?
(Essay)
5.0/5 (50)
When a new major league baseball stadium is built in the suburbs of a large city, the rents of apartments surrounding the stadium skyrocket because:
(Multiple Choice)
4.7/5 (38)
Labor supply in the purchasing profession can be represented by the equation LS = 10 + W, whereas labor demand can be depicted as LD = 40 − 4W.
a. What is the equilibrium number of workers hired and their wage in this profession?
b. Workers see that the number of good positions in other professions is shrinking, so they shift into the purchasing profession, causing labor supply to be two times what it used to be. What is the equilibrium number of workers hired now? What wage do they earn?
c. When will workers stop changing professions? Or will this process continue indefinitely?
(Essay)
4.8/5 (31)
Filters
- Essay(0)
- Multiple Choice(0)
- Short Answer(0)
- True False(0)
- Matching(0)