Exam 14: The Demand and Supply of Resources
Exam 1: The Five Foundations of Economics101 Questions
Exam 2: Model Building and Gains From Trade149 Questions
Exam 3: The Market at Work: Supply and Demand142 Questions
Exam 4: Elasticity141 Questions
Exam 5: Price Controls135 Questions
Exam 6: The Efficiency of Markets and the Costs of Taxation152 Questions
Exam 7: Market Inefficiencies: Externalities and Public Goods145 Questions
Exam 8: Business Costs and Production149 Questions
Exam 9: Firms in a Competitive Market145 Questions
Exam 10: Understanding Monopoly149 Questions
Exam 11: Price Discrimination138 Questions
Exam 12: Monopolistic Competition and Advertising133 Questions
Exam 13: Oligopoly and Strategic Behavior151 Questions
Exam 14: The Demand and Supply of Resources135 Questions
Exam 15: Income, Inequality, and Poverty128 Questions
Exam 16: Consumer Choice127 Questions
Exam 17: Behavioral Economics and Risk Taking134 Questions
Exam 18: Health Insurance and Health Care124 Questions
Select questions type
The government lowers the retirement age to 55. We would expect to see the labor supply curve:
(Multiple Choice)
4.8/5  (34)
(34)
It is profitable for a Jack's Jingles to use more equipment in the production of its songs when the:
(Multiple Choice)
4.7/5 (28)
Maxine finds that she is consistently unable to fill all of the open positions at her bakery. This indicates that the wage she is offering is:
(Multiple Choice)
4.9/5 (41)
The citizens of Kingsville notice that their friends and family in the neighboring city of Deville are earning higher wages. We would expect the labor supply in Kingsville ________ and the labor supply in Deville to ________.
(Multiple Choice)
4.8/5 (39)
A formerly quiet town with fantastic weather becomes "the place" to live for people from colder climates. We can expect the rental price of land to _________ land to be devoted to housing.
(Multiple Choice)
5.0/5 (32)
The accompanying graph represents Zendar's labor market. Use this graph to answer the questions. 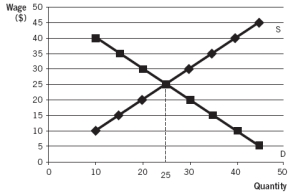 -What is the equilibrium number of workers in Zendar?
(Multiple Choice)
4.8/5 (32)
Mary decides that worker turnover is too high at her firm. She hopes that, by paying above-market wages, workers will stay longer. This may create:
(Multiple Choice)
4.9/5 (36)
Refer to the accompanying graphs to answer the questions.
Graph A 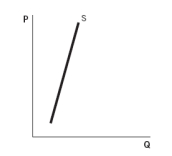 Graph B
 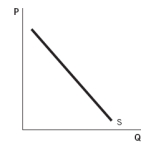 Graph C
 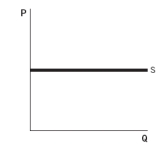 Graph D
 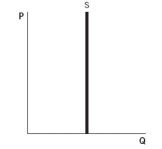 Graph E
 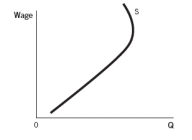 -Which graph shows a person who has a fixed quantity of hours that she is willing to work per week?
(Multiple Choice)
4.9/5 (39)
Amy just applied for a position with Rory's firm. Rory knows that Amy will earn $20 an hour and can produce a value of the marginal product of labor (VMPL) of $40. Rory will _________ Amy because her VMPL is _________.
(Multiple Choice)
4.8/5 (31)
The earth's major governments have recently decided to combine their resources to launch an effective plan to colonize the moon.
a. Graph the market for land on the moon before the colonization effort is successful.
b. What impact will the moon base have on the rental price of land on earth? Graph and explain.
(Essay)
4.8/5 (24)
Refer to the accompanying table to answer the questions. Number of Workers Output 1 20 2 30 3 38 4 42 5 44
-If the price of output falls from $5 to $2, the value of the marginal product of labor of all workers:
(Multiple Choice)
4.9/5 (34)
If the price of pencils falls, the marginal product of labor will _________ and the value of the marginal product of labor will _________.
(Multiple Choice)
4.9/5 (29)
The accompanying graph represents Zendar's labor market. Use this graph to answer the questions.
-At all wages below _________, there will be _________.
(Multiple Choice)
4.7/5 (41)
Use the accompanying table, which shows the supply and demand schedules for workings in the country of Hovian, to answer the questions. Wage Quantity of Workers Demanded Quantity of Workers Supplied \ 10 150 75 \ 20 100 100 \ 30 75 125 \ 40 60 135 \ 50 40 125
-If the wage is temporarily set at $25, it will need to ________ to restore equilibrium.
(Multiple Choice)
5.0/5 (35)
The government raises the minimum wage. Which graph reflects this situation? Graph A 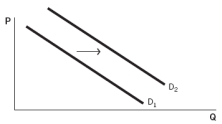 Graph B
 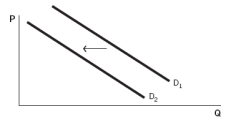 Graph C
 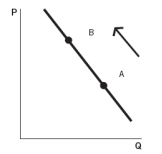 Graph D
 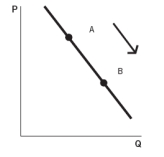 Graph E
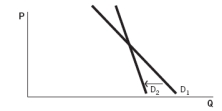
(Multiple Choice)
4.7/5 (35)
If more of the production process for automobiles were switched over to machines, the demand for auto-factory assembly-line workers would _________ for machine maintenance.
(Multiple Choice)
4.8/5 (29)
As computer usage in companies and in the home has increased, the labor demand for IT workers has:
(Multiple Choice)
4.9/5 (47)
Filters
- Essay(0)
- Multiple Choice(0)
- Short Answer(0)
- True False(0)
- Matching(0)