Exam 13: GlM 2: Comparing Means Adjusted for Other Predictors Analysis of Covariance
Exam 1: Why Is My Evil Lecturer Forcing Me to Learn Statistics26 Questions
Exam 2: The Spine of Statistics29 Questions
Exam 3: The Phoenix of Statistics16 Questions
Exam 4: The IBM Spss Statistics Environment27 Questions
Exam 5: Exploring Data With Graphs23 Questions
Exam 6: The Beast of Bias32 Questions
Exam 7: Non-Parametric Models21 Questions
Exam 8: Correlation19 Questions
Exam 9: Regression33 Questions
Exam 10: Comparing Two Means20 Questions
Exam 11: Moderation, Mediation and More Regression21 Questions
Exam 12: GlM 1: Comparing Several Independent Means28 Questions
Exam 13: GlM 2: Comparing Means Adjusted for Other Predictors Analysis of Covariance20 Questions
Exam 14: GlM 3: Factorial Designs30 Questions
Exam 15: GlM 4: Repeated-Measures Designs31 Questions
Exam 16: GlM 5: Mixed Designs19 Questions
Exam 17: Multivariate Analysis of Variance Manova20 Questions
Exam 18: Exploratory Factor Analysis19 Questions
Exam 19: Categorical Outcomes: Chi-Square and Loglinear Analysis19 Questions
Exam 20: Categorical Outcomes: Logistic Regression20 Questions
Exam 21: Multilevel Linear Models20 Questions
Select questions type
A psychologist was interested in the effects of different fear information on children's beliefs about an animal. Three groups of children were shown a picture of an animal that they had never seen before (a quoll). Then one group was told a negative story (in which the quoll is described as a vicious, disease-ridden bundle of nastiness that eats children's brains), one group a positive story (in which the quoll is described as a harmless, docile creature who likes nothing more than to be stroked), and a final group weren't told a story at all. After the story children rated how scared they would be if they met a quoll, on a scale ranging from 1 (not at all scared) to 5 (very scared indeed). To account for the natural anxiousness of each child, a questionnaire measure of trait anxiety was given to the children and used in the analysis.
-The SPSS output is below. What analysis has been used? 
Free
(Multiple Choice)
4.8/5  (33)
(33)
Correct Answer: Verified
C
Imagine we wanted to investigate the effects of three different conflict styles (avoiding, compromising and competing) on relationship satisfaction, but we discover that relationship satisfaction is known to be affected by self-esteem. Which of the following variables would be the covariate in this study?
Free
(Multiple Choice)
4.8/5 (30)
Correct Answer:Verified
D
A music teacher had noticed that some students went to pieces during exams. He wanted to test whether this performance anxiety was different for people playing different instruments. He took groups of guitarists, drummers and pianists (variable = 'Instru') and measured their anxiety (variable = 'Anxiety') during the exam. He also noted the type of exam they were performing (in the UK, musical instrument exams are known as 'grades' and range from 1 to 8). He wanted to see whether the type of instrument played affected performance anxiety when accounting for the grade of the exam.
- Which of the following statements best reflects what the tables below tell us? 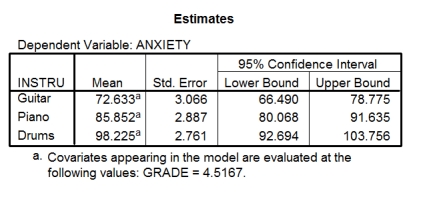
Free
(Multiple Choice)
4.8/5 (29)
Correct Answer:Verified
A
Which of the following assumptions must be met when conducting an ANCOVA?
(Multiple Choice)
4.7/5 (35)
Which of the following best describes how many covariates can be included in an ANCOVA?
(Multiple Choice)
4.8/5 (29)
Which of the following sentences best describes a covariate?
(Multiple Choice)
4.8/5 (34)
Imagine we wanted to investigate the effects of three different conflict styles (avoiding, compromising and competing) on relationship satisfaction, but we discover that relationship satisfaction is known to covary with self-esteem.
-Which of the following questions would be appropriate for this analysis?
(Multiple Choice)
4.8/5 (22)
Imagine we wanted to compare a group of married couples with a group of non-married couples on levels of relationship satisfaction. After collecting our data, we find that the mean age of our married group (M = 30) was significantly different from the mean age of our non-married group (M = 23). What should we do?
(Multiple Choice)
4.9/5 (32)
A music teacher had noticed that some students went to pieces during exams. He wanted to test whether this performance anxiety was different for people playing different instruments. He took groups of guitarists, drummers and pianists (variable = 'Instru') and measured their anxiety (variable = 'Anxiety') during the exam. He also noted the type of exam they were performing (in the UK, musical instrument exams are known as 'grades' and range from 1 to 8). He wanted to see whether the type of instrument played affected performance anxiety when accounting for the grade of the exam.
- Which of the following statements best reflects what the effect of GRADE in the table tells us? 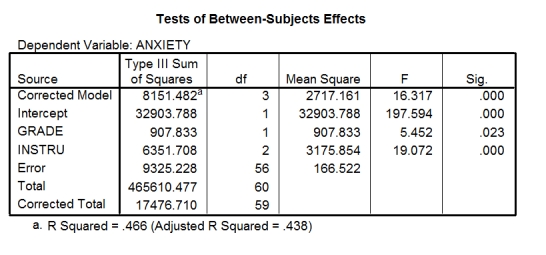
(Multiple Choice)
4.9/5 (38)
A music teacher had noticed that some students went to pieces during exams. He wanted to test whether this performance anxiety was different for people playing different instruments. He took groups of guitarists, drummers and pianists (variable = 'Instru') and measured their anxiety (variable = 'Anxiety') during the exam. He also noted the type of exam they were performing (in the UK, musical instrument exams are known as 'grades' and range from 1 to 8). He wanted to see whether the type of instrument played affected performance anxiety when accounting for the grade of the exam.
-The first part of the SPSS output is below. What does this part of the output tell us? 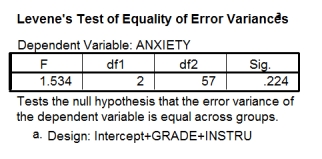
(Multiple Choice)
4.8/5 (25)
Imagine we wanted to investigate the effects of three different conflict styles (avoiding, compromising and competing) on relationship satisfaction. We discover that relationship satisfaction is known to covary with self-esteem, so we conduct an ANCOVA with self-esteem as the covariate. What could be a potential issue with this study?
(Multiple Choice)
4.8/5 (29)
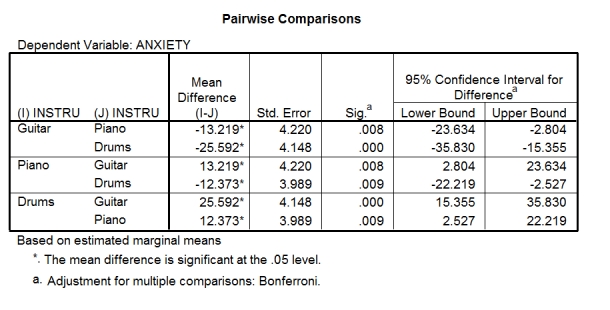
A music teacher had noticed that some students went to pieces during exams. He wanted to test whether this performance anxiety was different for people playing different instruments. He took groups of guitarists, drummers and pianists (variable = 'Instru') and measured their anxiety (variable = 'Anxiety') during the exam. He also noted the type of exam they were performing (in the UK, musical instrument exams are known as 'grades' and range from 1 to 8). He wanted to see whether the type of instrument played affected performance anxiety when accounting for the grade of the exam.
-Which of the following statements best reflects what the effect of 'Instru' in the output table below tells us? 
(Multiple Choice)
4.9/5 (29)
Imagine we wanted to investigate the effects of three different conflict styles (avoiding, compromising and competing) on relationship satisfaction. We discover that relationship satisfaction is known to covary with self-esteem.
-Conducting an ANCOVA will partial out the variance due to the association between which two variables?
(Multiple Choice)
4.7/5 (32)
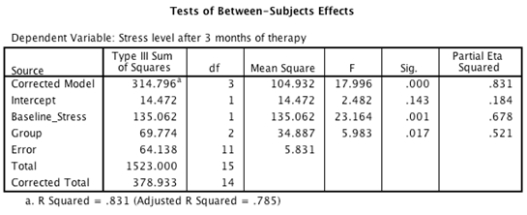
Participants were randomly allocated to one of two stress management therapy groups, or a waiting list control group. Their baseline levels of stress were measured before treatment, and again after 3 months of weekly therapy sessions. Based on the output below, which of the following statements is the most accurate? 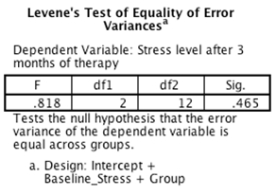
(Multiple Choice)
4.9/5 (34)
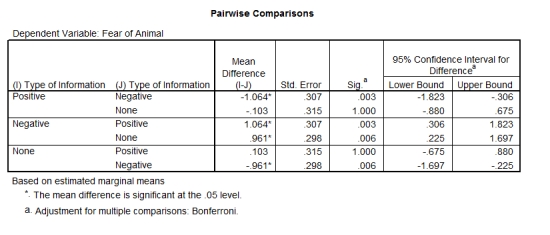
A psychologist was interested in the effects of different fear information on children's beliefs about an animal. Three groups of children were shown a picture of an animal that they had never seen before (a quoll). Then one group was told a negative story (in which the quoll is described as a vicious, disease-ridden bundle of nastiness that eats children's brains), one group a positive story (in which the quoll is described as a harmless, docile creature who likes nothing more than to be stroked), and a final group weren't told a story at all. After the story children rated how scared they would be if they met a quoll, on a scale ranging from 1 (not at all scared) to 5 (very scared indeed). To account for the natural anxiousness of each child, a questionnaire measure of trait anxiety was given to the children and used in the analysis.
-Which of the following statements best reflects what the 'pairwise comparisons' tell us? 


(Multiple Choice)
4.8/5 (41)
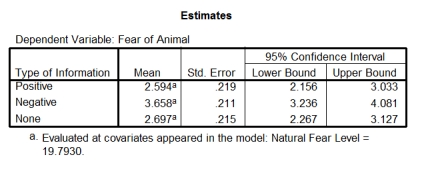
A psychologist was interested in the effects of different fear information on children's beliefs about an animal. Three groups of children were shown a picture of an animal that they had never seen before (a quoll). Then one group was told a negative story (in which the quoll is described as a vicious, disease-ridden bundle of nastiness that eats children's brains), one group a positive story (in which the quoll is described as a harmless, docile creature who likes nothing more than to be stroked), and a final group weren't told a story at all. After the story children rated how scared they would be if they met a quoll, on a scale ranging from 1 (not at all scared) to 5 (very scared indeed). To account for the natural anxiousness of each child, a questionnaire measure of trait anxiety was given to the children and used in the analysis.
-Which of the following statements best reflects what the effect of 'Type Of Information' in the table tells us? 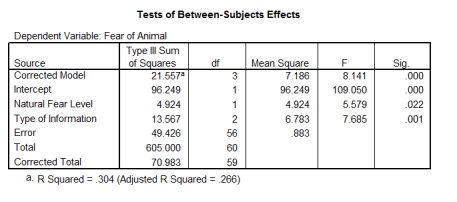
(Multiple Choice)
4.8/5 (39)
Participants were randomly allocated to one of two stress management therapy groups, or a waiting list control group. Their baseline levels of stress were measured before treatment, and again after 3 months of weekly therapy sessions. The researcher decided to run an ANCOVA on her data. What was the covariate?
(Multiple Choice)
4.8/5 (38)
What are the two main reasons for including covariates in ANOVA?
(Multiple Choice)
4.9/5 (33)
A psychologist was interested in the effects of different fear information on children's beliefs about an animal. Three groups of children were shown a picture of an animal that they had never seen before (a quoll). Then one group was told a negative story (in which the quoll is described as a vicious, disease-ridden bundle of nastiness that eats children's brains), one group a positive story (in which the quoll is described as a harmless, docile creature who likes nothing more than to be stroked), and a final group weren't told a story at all. After the story children rated how scared they would be if they met a quoll, on a scale ranging from 1 (not at all scared) to 5 (very scared indeed). To account for the natural anxiousness of each child, a questionnaire measure of trait anxiety was given to the children and used in the analysis.
-Which of the following statements best reflects what the effect of 'Natural Fear Level' in the table tells us? 
(Multiple Choice)
4.8/5 (43)
Filters
- Essay(0)
- Multiple Choice(0)
- Short Answer(0)
- True False(0)
- Matching(0)