Exam 15: GlM 4: Repeated-Measures Designs
Exam 1: Why Is My Evil Lecturer Forcing Me to Learn Statistics26 Questions
Exam 2: The Spine of Statistics29 Questions
Exam 3: The Phoenix of Statistics16 Questions
Exam 4: The IBM Spss Statistics Environment27 Questions
Exam 5: Exploring Data With Graphs23 Questions
Exam 6: The Beast of Bias32 Questions
Exam 7: Non-Parametric Models21 Questions
Exam 8: Correlation19 Questions
Exam 9: Regression33 Questions
Exam 10: Comparing Two Means20 Questions
Exam 11: Moderation, Mediation and More Regression21 Questions
Exam 12: GlM 1: Comparing Several Independent Means28 Questions
Exam 13: GlM 2: Comparing Means Adjusted for Other Predictors Analysis of Covariance20 Questions
Exam 14: GlM 3: Factorial Designs30 Questions
Exam 15: GlM 4: Repeated-Measures Designs31 Questions
Exam 16: GlM 5: Mixed Designs19 Questions
Exam 17: Multivariate Analysis of Variance Manova20 Questions
Exam 18: Exploratory Factor Analysis19 Questions
Exam 19: Categorical Outcomes: Chi-Square and Loglinear Analysis19 Questions
Exam 20: Categorical Outcomes: Logistic Regression20 Questions
Exam 21: Multilevel Linear Models20 Questions
Select questions type
Imagine we were interested in the effect of supporters singing on the number of goals scored by soccer teams. We took 10 groups of supporters of 10 different soccer teams and asked them to attend three home games, one at which they were instructed to sing in support of their team (e.g., 'Come on, you Reds!'), one at which they were instructed to sing negative songs towards the opposition (e.g., 'You're getting sacked in the morning!') and one at which they were instructed to sit quietly. The order of chanting was counterbalanced across groups.
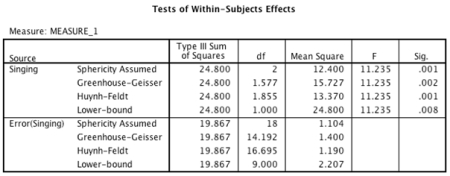
-Looking at the output below, which of the following sentences is correct? Descriptive Statistics Mean Std. Deviation Number of goals scored When supporters sang songs of encouragement to their team 2.90 1.197 10 Number of goals scored when supporters sang songs of abuse towards the opposition .70 .675 10 Number of goals scored when supporters sat quietly 1.50 1.080 10 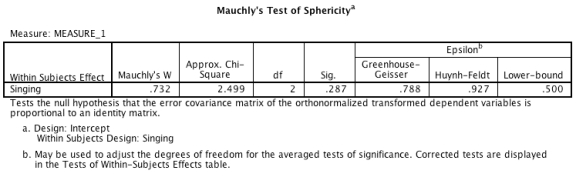 Tests of Within-Subjects Effects
Measure: MEASURE_1
Source Type III Sum of Squares df Mean Square Sig. Singing Sphericity Assumed 24.800 2 12.400 11.235 .001 Greenhouse-Ceisser 24.800 1.577 15.727 11.235 .002 Huynh-Feldt 24.800 1.855 13.370 11.235 .001 Lower-bound 24.800 1.000 24.800 11.235 .008 ErroriSinging) Sphericity Assumed 19.867 18 1.104 Greenhouse-Ceisser 19.867 14.192 1.400 Huynh-Feldt 19.867 16.695 1.190 Lower-bound 19.867 9.000 2.207
Tests of Within-Subjects Effects
Measure: MEASURE_1
Source Type III Sum of Squares df Mean Square Sig. Singing Sphericity Assumed 24.800 2 12.400 11.235 .001 Greenhouse-Ceisser 24.800 1.577 15.727 11.235 .002 Huynh-Feldt 24.800 1.855 13.370 11.235 .001 Lower-bound 24.800 1.000 24.800 11.235 .008 ErroriSinging) Sphericity Assumed 19.867 18 1.104 Greenhouse-Ceisser 19.867 14.192 1.400 Huynh-Feldt 19.867 16.695 1.190 Lower-bound 19.867 9.000 2.207
Free
(Multiple Choice)
4.9/5  (34)
(34)
Correct Answer: Verified
A
Imagine we were interested in the effect of supporters singing on the number of goals scored by soccer teams. We took 10 groups of supporters of 10 different soccer teams and asked them to attend three home games, one at which they were instructed to sing in support of their team (e.g., ‘Come on, you Reds!’), one at which they were instructed to sing negative songs towards the opposition (e.g., ‘You’re getting sacked in the morning!’) and one at which they were instructed to sit quietly. The order of chanting was counterbalanced across groups.
- An ANOVA with a simple contrasts using the last category as a reference was conducted. Looking at the output tables below, what does the first contrast (Level 1 vs. Level 3) compare?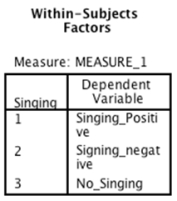
 Tests of Within-Subjects Contrasts
Measure: MEASURE_1
Source Sinqing Type IIl Sum of Squares df Mean Square F Sig. Singing Level 1 vs. Level 3 19.600 1 19.600 7.230 .025 Level 2 vs. Level 3 6.400 1 6.400 6.000 .037 Error(Singing) Level 1 vs. Level 3 24.400 9 2.711 Level 2 vs. Level 3 9.600 9 1.067
Tests of Within-Subjects Contrasts
Measure: MEASURE_1
Source Sinqing Type IIl Sum of Squares df Mean Square F Sig. Singing Level 1 vs. Level 3 19.600 1 19.600 7.230 .025 Level 2 vs. Level 3 6.400 1 6.400 6.000 .037 Error(Singing) Level 1 vs. Level 3 24.400 9 2.711 Level 2 vs. Level 3 9.600 9 1.067
Free
(Multiple Choice)
4.8/5 (28)
Correct Answer:Verified
A
When entering data for a repeated-measures design in SPSS:
Free
(Multiple Choice)
4.9/5 (33)
Correct Answer:Verified
C
An educational researcher wanted to test the impact of learning environment on children's ability to concentrate on a short reading comprehension task. There were four different environmental settings: 'Noisy', 'Chill Out', 'Cold', and 'Screen on' and a group of twenty randomly selected children. He wanted to compare the impact of each setting on each child's individual concertation times and across the group, as well as any interaction effects. What sort of test design best suits this study?
(Multiple Choice)
4.9/5 (41)
Which of the following is a means to correct for Sphericity?
(Multiple Choice)
4.7/5 (34)
What is the consequence of violating the assumption of Sphericity?
(Multiple Choice)
4.9/5 (29)
When an experimental manipulation is carried out on the same entities, the within-participant variance will be made up of:
(Multiple Choice)
4.8/5 (33)
Which of these are potential sources of bias in a Repeated measures factorial design?
(Multiple Choice)
4.9/5 (31)
Imagine we were interested in the effect of supporters singing on the number of goals scored by soccer teams. We took 10 groups of supporters of 10 different soccer teams and asked them to attend three home games, one at which they were instructed to sing in support of their team (e.g., 'Come on, you Reds!'), one at which they were instructed to sing negative songs towards the opposition (e.g., 'You're getting sacked in the morning!') and one at which they were instructed to sit quietly. The order of chanting was counterbalanced across groups.
-An ANOVA with a simple contrasts using the last category as a reference was conducted. Looking at the output tables below, which of the following sentences regarding the contrasts is correct? 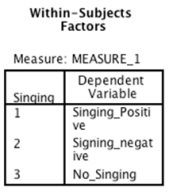 Descriptive Statistics Mean Std. Deviation Number of goals scored when supporters sang songs of encouragement to their team 2.90 1.197 10 Number of goals scored when supporters sang songs of abuse towards the opposition .70 .675 10 Number of goals scored when supporters sat quietly 1.50 1.080 10
 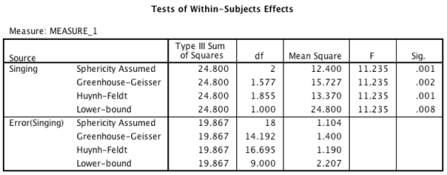 Tests of Within-Subjects Contrasts
Measure: MEASURE_1
Source Singing Type III Sum of Squares df Mean Square F Sig. Singing Level 1 vs. Level 3 19.600 1 19.600 7.230 .025 Level 2 vs. Level 3 6.400 1 6.400 6.000 .037 Error(Singing) Level 1 vs. Level 3 24.400 9 2.711 Level 2 vs. Level 3 9.600 9 1.067
Tests of Within-Subjects Contrasts
Measure: MEASURE_1
Source Singing Type III Sum of Squares df Mean Square F Sig. Singing Level 1 vs. Level 3 19.600 1 19.600 7.230 .025 Level 2 vs. Level 3 6.400 1 6.400 6.000 .037 Error(Singing) Level 1 vs. Level 3 24.400 9 2.711 Level 2 vs. Level 3 9.600 9 1.067
(Multiple Choice)
4.9/5 (36)
Imagine we were interested in the effect of supporters singing on the number of goals scored by soccer teams. We took 10 groups of supporters of 10 different soccer teams and asked them to attend three home games, one at which they were instructed to sing in support of their team (e.g., 'Come on, you reds!'), one at which they were instructed to sing negative songs towards the opposition (e.g., 'You're getting sacked in the morning!') and one at which they were instructed to sit quietly. The order of chanting was counterbalanced across groups.
- A one-way repeated-measures ANOVA was conducted and post hoc tests were selected. Looking at the output below, which of the following sentences regarding the pairwise comparisons is correct? 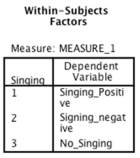
 Descriptive Statistics Mean Std. Deviation Number of goals scored when supporters sang songs of encouragement to their team 2.90 1.197 10 Number of goals scored when supporters sang songs of abuse towards the opposition .70 .675 10 Number of goals scored when supporters sat quietly 1.50 1.080 10
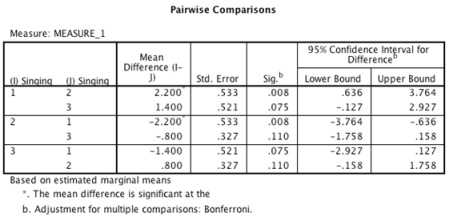
(Multiple Choice)
4.8/5 (30)
Imagine we were trying to interpret the results of a 3 3 two-way repeated-measures ANOVA. The data analysis contains no information about sphericity. In this situation, which of the following rows from the output should be interpreted?
(Multiple Choice)
4.9/5 (27)
Which of the following regarding the assumption of sphericity is false?
(Multiple Choice)
4.7/5 (30)
Imagine I ran a one-way repeated-measures ANOVA with five levels on the independent variable. The results revealed a Greenhouse-Geisser estimate, = .977, and the Huynh-Feldt estimate, = .999. What do these values tells us about the assumption of sphericity?
(Multiple Choice)
4.8/5 (32)
How many effects will there be from a two-way repeated-measures ANOVA?
(Multiple Choice)
4.9/5 (37)
Which of the following is a source of variance in a three-way repeated-measures ANOVA?
(Multiple Choice)
4.8/5 (32)
The results of a one-way repeated-measures ANOVA with four levels on the independent variable revealed a significance value for Mauchly's test of p = 0.048. What does this mean?
(Multiple Choice)
4.7/5 (39)
A medical researcher wanted to test the impact of four different pain-relief drugs ('Placebo', 'Drug X', 'Drug Z' and 'Drug Y') on a group of twenty randomly selected patients with a long-term chronic illness. He wanted to compare the impact of each drug on each individual patient's rating of pain and across the group of patients, as well as any interaction effects. What sort of test design best suits this study?
(Multiple Choice)
4.9/5 (40)
Filters
- Essay(0)
- Multiple Choice(0)
- Short Answer(0)
- True False(0)
- Matching(0)