Exam 5: Elasticity of Demand and Supply
Exam 1: The Art and Science of Economic Analysis147 Questions
Exam 1: Appendix: Understanding Graphs64 Questions
Exam 2: Economic Tools and Economics Systems195 Questions
Exam 3: Economic Decision Makers200 Questions
Exam 4: Demand, Supply, and Markets232 Questions
Exam 5: Elasticity of Demand and Supply238 Questions
Exam 6: Consumer Choice and Demand170 Questions
Exam 7: Production and Cost in the Firm209 Questions
Exam 8: A: Perfect Competition249 Questions
Exam 8: B: Perfect Competition22 Questions
Exam 9: A: Monopoly249 Questions
Exam 9: B: Monopoly13 Questions
Exam 10: Monopolistic Competition and Oligopoly226 Questions
Exam 11: Resource Markets216 Questions
Exam 12: Labor Markets and Labor Unions213 Questions
Exam 13: Capital, Interest, and Corporate Finance186 Questions
Exam 14: Transaction Costs, Imperfect Information, and Behavioral Economics186 Questions
Exam 15: Economic Regulation and Antitrust Policy182 Questions
Exam 16: Public Goods and Public Choice139 Questions
Exam 17: Externalities and the Environment194 Questions
Exam 18: Income Distribution and Poverty125 Questions
Exam 19: International Trade163 Questions
Exam 20: International Finance231 Questions
Exam 21: Economic Development110 Questions
Select questions type
If the demand curve shifts but the supply curve does not and price remains the same, supply must be perfectly inelastic.
(True/False)
4.8/5  (37)
(37)
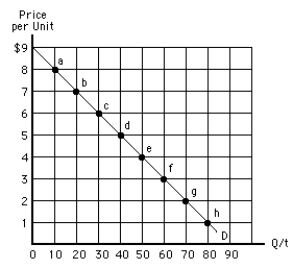
NARRBEGIN: Exhibit 5-9
Exhibit 5-9
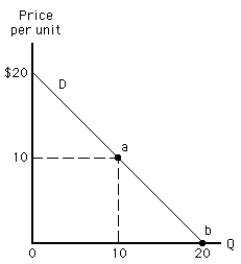 -Between points a and b on the demand curve in Exhibit 5-9, demand is
(Multiple Choice)
4.9/5 (24)
A normal good is defined as a product for which quantity demanded increases as price decreases.
(True/False)
4.7/5 (36)
For which of the following is demand most likely to be perfectly inelastic?
(Multiple Choice)
4.9/5 (30)
One group of people uses New York City subways only during rush hour to travel to and from work. Another group uses them only in midday for leisure activity. If New York City wants to increase transit fares with the smallest possible reduction in revenue, for which group should it increase the fare?
(Multiple Choice)
4.8/5 (25)
Given the availability of California oranges, demand for Florida oranges will
(Multiple Choice)
4.8/5 (31)
For which of the following products is the consumer's demand curve most likely to be vertical?
(Multiple Choice)
4.8/5 (33)
Which of the following describes a situation in which demand must be elastic?
(Multiple Choice)
4.8/5 (39)
Income elasticity of demand is greater than zero for all of the following except
(Multiple Choice)
4.7/5 (28)
NARRBEGIN: Exhibit 5-24
Exhibit 5-24
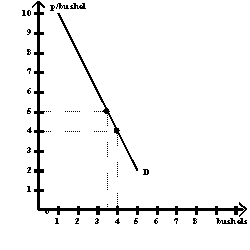 -Exhibit 5-24 shows a hypothetical demand curve for soybeans. The vertical axis measures the average price per bushel in dollars. The horizontal axis measures billions of bushels per year. If perfect weather boosts the harvest from 3.5 billion bushels to 4.0 billion bushels (a 13 percent increase), what must happen to average price in order for the increased production to be sold?
(Multiple Choice)
4.8/5 (31)
NARRBEGIN: Exhibit 5-8
Exhibit 5-8
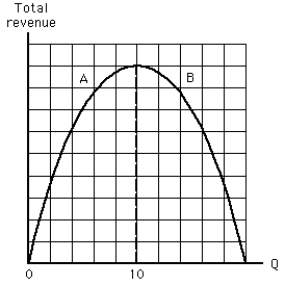 -Which of the following statements is true in the range of the total revenue curve labeled A in Exhibit 5-8?
(Multiple Choice)
4.9/5 (28)
NARRBEGIN: Exhibit 5-4
Exhibit 5-4
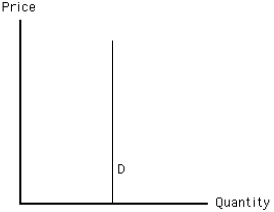 -Demand in Exhibit 5-4 is
(Multiple Choice)
4.7/5 (38)
NARRBEGIN: Exhibit 5-7
Exhibit 5-7
 -In Exhibit 5-7, demand is unit elastic
(Multiple Choice)
4.8/5 (31)
If the cross-price elasticity of demand between good x and good y is 0.4, then
(Multiple Choice)
4.8/5 (33)
In calculating price elasticity of demand, which of the following is assumed to be constant?
(Multiple Choice)
4.8/5 (35)
Filters
- Essay(0)
- Multiple Choice(0)
- Short Answer(0)
- True False(0)
- Matching(0)