Exam 1: Appendix: Understanding Graphs
Exam 1: The Art and Science of Economic Analysis147 Questions
Exam 1: Appendix: Understanding Graphs64 Questions
Exam 2: Economic Tools and Economics Systems195 Questions
Exam 3: Economic Decision Makers200 Questions
Exam 4: Demand, Supply, and Markets232 Questions
Exam 5: Elasticity of Demand and Supply238 Questions
Exam 6: Consumer Choice and Demand170 Questions
Exam 7: Production and Cost in the Firm209 Questions
Exam 8: A: Perfect Competition249 Questions
Exam 8: B: Perfect Competition22 Questions
Exam 9: A: Monopoly249 Questions
Exam 9: B: Monopoly13 Questions
Exam 10: Monopolistic Competition and Oligopoly226 Questions
Exam 11: Resource Markets216 Questions
Exam 12: Labor Markets and Labor Unions213 Questions
Exam 13: Capital, Interest, and Corporate Finance186 Questions
Exam 14: Transaction Costs, Imperfect Information, and Behavioral Economics186 Questions
Exam 15: Economic Regulation and Antitrust Policy182 Questions
Exam 16: Public Goods and Public Choice139 Questions
Exam 17: Externalities and the Environment194 Questions
Exam 18: Income Distribution and Poverty125 Questions
Exam 19: International Trade163 Questions
Exam 20: International Finance231 Questions
Exam 21: Economic Development110 Questions
Select questions type
If the dependent variable Y is directly related to the independent variable X, this means that changes in X cause changes in Y.
(True/False)
4.9/5  (45)
(45)
NARRBEGIN: Exhibit 1-14
Exhibit 1-16
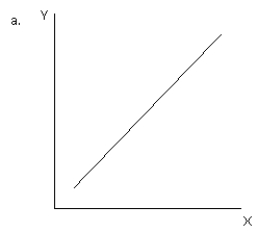
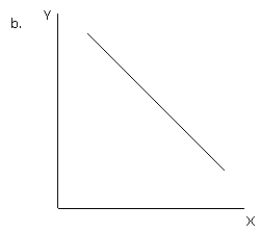
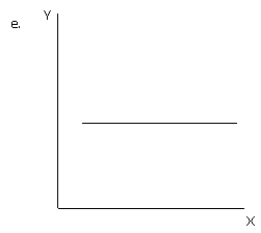 -Refer to exhibit 1-16. Which of the graphs illustrates an inverse or negative relationship between variable X and variable Y?
(Multiple Choice)
4.9/5 (34)
NARRBEGIN: Exhibit 1-5
Exhibit 1-7
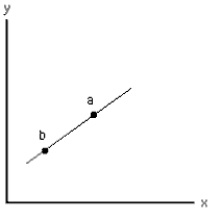 -The slope of the straight line in Exhibit 1-5 is
(Multiple Choice)
4.8/5 (27)
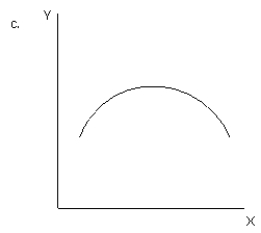
The slope of an inverted U-shaped curve is infinity at the top of the curve.
(True/False)
4.7/5 (37)
NARRBEGIN: Exhibit 1-9
Exhibit 1-11
 -In Exhibit 1-9, the slope of the line is
(Multiple Choice)
4.8/5 (38)
The numerical value of the slope of a line depends in part on the units of measurement used.
(True/False)
4.7/5 (27)
NARRBEGIN: Exhibit 1-14
Exhibit 1-16
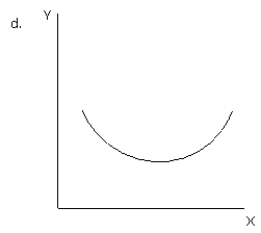
-Refer to exhibit 1-16. Which of the graphs illustrates a direct or positive relationship between variable X and variable Y?
(Multiple Choice)
4.9/5 (41)
NARRBEGIN: Exhibit 1-2-2
Exhibit 1-5
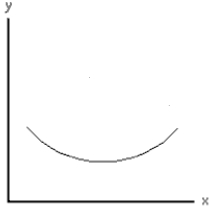
 -In Exhibit 1-2, curve A has a __________ slope that is __________ at every point.
(Multiple Choice)
4.7/5 (34)
NARRBEGIN: Exhibit 1-2-1
Exhibit 1-2
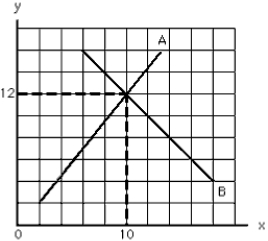 -In Exhibit 1-2, at x = 10, the
(Multiple Choice)
5.0/5 (34)
If a given value of x is associated with a particular value of y,
(Multiple Choice)
4.8/5 (37)
If slope = 2 for a line on a graph with x on the horizontal axis and y on the vertical axis, then if
(Multiple Choice)
4.9/5 (35)
A curved line may have a positive slope or a negative slope, but it cannot have both positive and negative areas of slope.
(True/False)
4.9/5 (44)
A functional relationship exists between two variables if the value of one variable depends on the value of the other variable.
(True/False)
4.9/5 (38)
NARRBEGIN: Exhibit 1-4-1
Exhibit 1-4
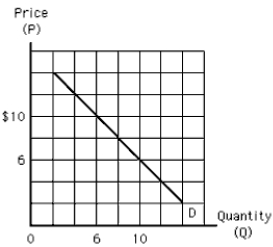 -Which of the following must be true of line D in Exhibit 1-4?
(Multiple Choice)
4.7/5 (33)
NARRBEGIN: Exhibit 1-14
Exhibit 1-16
-Refer to exhibit 1-16. Which of the graphs illustrates no relationship between variable X and variable Y?
(Multiple Choice)
4.9/5 (24)
Most economics graphs reflect the relationship between how many economic variables?
(Multiple Choice)
4.7/5 (32)
NARRBEGIN: Exhibit 1-2-1
Exhibit 1-2
-In Exhibit 1-2, at x = 12, the
(Multiple Choice)
4.9/5 (40)
NARRBEGIN: Exhibit 1-4-2
Exhibit 1-6
 -Along the curve in Exhibit 1-4,
(Multiple Choice)
4.9/5 (40)
Filters
- Essay(0)
- Multiple Choice(0)
- Short Answer(0)
- True False(0)
- Matching(0)