Exam 12: The Determination of Aggregate Output, the Price Level, and the Interest Rate
Exam 1: The Scope and Method of Economics120 Questions
Exam 2: The Economic Problem: Scarcity and Choice110 Questions
Exam 3: Demand,supply,and Market Equilibrium144 Questions
Exam 4: Demand and Supply Applications86 Questions
Exam 5: Introduction to Macroeconomics121 Questions
Exam 6: Measuring National Output and National Income146 Questions
Exam 7: Unemployment, inflation, and Long-Run Growth149 Questions
Exam 8: Aggregate Expenditure and Equilibrium Output176 Questions
Exam 9: The Government and Fiscal Policy179 Questions
Exam 10: The Money Supply and the Federal Reserve System144 Questions
Exam 11: Money Demand and the Equilibrium Interest Rate129 Questions
Exam 12: The Determination of Aggregate Output, the Price Level, and the Interest Rate119 Questions
Exam 13: Policy Effects and Costs Shocks in the Asad Model102 Questions
Exam 14: The Labor Market in the Macroeconomy147 Questions
Exam 15: Financial Crises, stabilization, and Deficits129 Questions
Exam 16: Household and Firm Behavior in the Macroeconomy: a Further Look185 Questions
Exam 17: Long-Run Growth93 Questions
Exam 18: Alternative Views in Macroeconomics147 Questions
Exam 19: International Trade,comparative Advantage,and Protectionism151 Questions
Exam 20: Open-Economy Macroeconomics: the Balance of Payments and Exchange Rates160 Questions
Exam 21: Economic Growth in Developing and Transitional Economies105 Questions
Select questions type
If the combination r = 5% and Y = $100 billion is on the Fed rule line,we know that the combination r = 7% and Y = $100 billion would represent
(Multiple Choice)
4.9/5  (37)
(37)
The Federal Reserve's policy to "lean against the wind" means that
(Multiple Choice)
4.9/5 (27)
An increase in the price of a key input in production,like oil,increases aggregate supply.
(True/False)
4.7/5 (45)
Which of the following equations represents equilibrium in the goods market?
(Multiple Choice)
4.9/5 (28)
Refer to the information provided in Figure 12.3 below to answer the questions that follow. 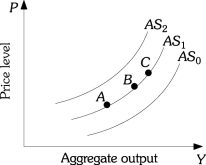 Figure 12.3
-Refer to Figure 12.3.Hurricane Katrina destroyed a large portion of the infrastructure along the Gulf of Mexico coast.This caused
Figure 12.3
-Refer to Figure 12.3.Hurricane Katrina destroyed a large portion of the infrastructure along the Gulf of Mexico coast.This caused
(Multiple Choice)
5.0/5 (39)
Refer to the information provided in Figure 12.6 below to answer the questions that follow. 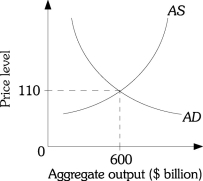 Figure 12.6
-Refer to Figure 12.6.Suppose the equilibrium output is initially $600 billion.A decrease in wages and an increase in government spending will,for sure,increase
Figure 12.6
-Refer to Figure 12.6.Suppose the equilibrium output is initially $600 billion.A decrease in wages and an increase in government spending will,for sure,increase
(Multiple Choice)
4.9/5 (26)
Other things equal,an increase in the price level ________ the equilibrium interest rate and ________ equilibrium output.
(Multiple Choice)
4.8/5 (28)
Refer to the information provided in Figure 12.8 below to answer the questions that follow. 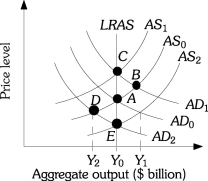 Figure 12.8
-Refer to Figure 12.8.If the economy is at point A currently producing Y0 and the Z factors increase,the economy will move to Point ________ in the short run and to Point ________ in the long run.
Figure 12.8
-Refer to Figure 12.8.If the economy is at point A currently producing Y0 and the Z factors increase,the economy will move to Point ________ in the short run and to Point ________ in the long run.
(Multiple Choice)
4.7/5 (31)
Whenever the aggregate supply curve intercepts the aggregate demand curve,the economy is producing full employment output.
(True/False)
4.9/5 (37)
A decrease in government spending shifts aggregate demand to the left.
(True/False)
5.0/5 (38)
Refer to the information provided in Figure 12.8 below to answer the questions that follow. Figure 12.8
-Refer to Figure 12.8.This economy cannot continue to produce Y1 (or at point B)because
(Multiple Choice)
4.9/5 (31)
When the interest rate is high,planned investment is ________ so output is ________.
(Multiple Choice)
4.8/5 (37)
The rationale underlying policies to deregulate the economy is that these policies would
(Multiple Choice)
4.9/5 (36)
Refer to the information provided in Figure 12.4 below to answer the questions that follow. 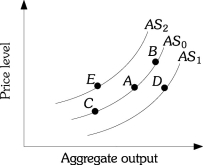 Figure 12.4
-Refer to Figure 12.4.Which of the following causes the economy to move from Point A to Point E?
Figure 12.4
-Refer to Figure 12.4.Which of the following causes the economy to move from Point A to Point E?
(Multiple Choice)
4.9/5 (37)
If the United States were to pass legislation that would make it easier for people to emigrate to the United States,this would cause
(Multiple Choice)
4.8/5 (43)
Refer to the information provided in Figure 12.3 below to answer the questions that follow. Figure 12.3
-Refer to Figure 12.3.A decrease in aggregate supply is represented by
(Multiple Choice)
4.8/5 (31)
Filters
- Essay(0)
- Multiple Choice(0)
- Short Answer(0)
- True False(0)
- Matching(0)