Exam 12: The Determination of Aggregate Output, the Price Level, and the Interest Rate
Exam 1: The Scope and Method of Economics120 Questions
Exam 2: The Economic Problem: Scarcity and Choice110 Questions
Exam 3: Demand,supply,and Market Equilibrium144 Questions
Exam 4: Demand and Supply Applications86 Questions
Exam 5: Introduction to Macroeconomics121 Questions
Exam 6: Measuring National Output and National Income146 Questions
Exam 7: Unemployment, inflation, and Long-Run Growth149 Questions
Exam 8: Aggregate Expenditure and Equilibrium Output176 Questions
Exam 9: The Government and Fiscal Policy179 Questions
Exam 10: The Money Supply and the Federal Reserve System144 Questions
Exam 11: Money Demand and the Equilibrium Interest Rate129 Questions
Exam 12: The Determination of Aggregate Output, the Price Level, and the Interest Rate119 Questions
Exam 13: Policy Effects and Costs Shocks in the Asad Model102 Questions
Exam 14: The Labor Market in the Macroeconomy147 Questions
Exam 15: Financial Crises, stabilization, and Deficits129 Questions
Exam 16: Household and Firm Behavior in the Macroeconomy: a Further Look185 Questions
Exam 17: Long-Run Growth93 Questions
Exam 18: Alternative Views in Macroeconomics147 Questions
Exam 19: International Trade,comparative Advantage,and Protectionism151 Questions
Exam 20: Open-Economy Macroeconomics: the Balance of Payments and Exchange Rates160 Questions
Exam 21: Economic Growth in Developing and Transitional Economies105 Questions
Select questions type
If government spending increases,then the IS curve shifts to the right.
Free
(True/False)
4.8/5  (37)
(37)
Correct Answer: Verified
True
An increase in aggregate demand when the economy is operating at full capacity is likely to result in
Free
(Multiple Choice)
4.8/5 (29)
Correct Answer:Verified
C
Refer to the information provided in Figure 12.3 below to answer the questions that follow. 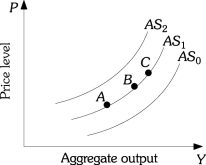 Figure 12.3
-Refer to Figure 12.3.An increase in aggregate supply is represented by
Figure 12.3
-Refer to Figure 12.3.An increase in aggregate supply is represented by
Free
(Multiple Choice)
4.9/5 (39)
Correct Answer:Verified
D
The change in consumption brought about by a change in purchasing power of savings that results from a change in the price level is the
(Multiple Choice)
4.7/5 (40)
An increase in the price level will cause a decrease in the aggregate amount of output supplied.
(True/False)
4.9/5 (41)
To increase the price level the government could adopt policies that
(Multiple Choice)
4.8/5 (25)
If the combination r = 10% and Y = $200 billion is on the IS curve,we know that the combination r = 10% and Y = $300 billion would represent
(Multiple Choice)
4.9/5 (42)
If there is a decrease in the percentage of employees whose wages adjust automatically with changes in the price level,the aggregate supply curve will become
(Multiple Choice)
4.9/5 (38)
An increase in the price of inputs will most likely lead to a higher price level.
(True/False)
4.7/5 (33)
If the price level falls,the aggregate supply decreases as a result of the aggregate demand curve shifting left.
(True/False)
4.8/5 (38)
Other things equal,an increase in government spending shifts
(Multiple Choice)
5.0/5 (28)
Refer to the information provided in Figure 12.4 below to answer the questions that follow. 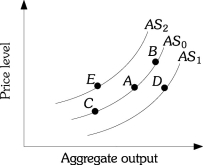 Figure 12.4
-Refer to Figure 12.4.Suppose the economy is at Point A,an oil price increase could move the economy to Point
Figure 12.4
-Refer to Figure 12.4.Suppose the economy is at Point A,an oil price increase could move the economy to Point
(Multiple Choice)
4.9/5 (28)
Refer to the information provided in Figure 12.5 below to answer the questions that follow. 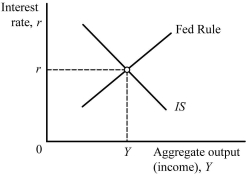 Figure 12.5
-Refer to Figure 12.5.An increase in government spending shifts the ________ to the ________.
Figure 12.5
-Refer to Figure 12.5.An increase in government spending shifts the ________ to the ________.
(Multiple Choice)
4.8/5 (36)
The IS curve shows combinations of output and interest rates consistent with equilibrium in the goods market.
(True/False)
4.8/5 (34)
Refer to the information provided in Figure 12.7 below to answer the questions that follow. 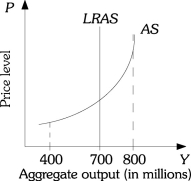 Figure 12.7
-Refer to Figure 12.7.Potential output
Figure 12.7
-Refer to Figure 12.7.Potential output
(Multiple Choice)
4.8/5 (35)
An increase in aggregate demand when the economy is operating at high levels of output is likely to result in
(Multiple Choice)
4.9/5 (40)
Refer to the information provided in Figure 12.5 below to answer the questions that follow. Figure 12.5
-Refer to Figure 12.5.Which of the following combinations would definitely increase the equilibrium interest rate?
(Multiple Choice)
4.9/5 (36)
Refer to the information provided in Figure 12.1 below to answer the questions that follow. 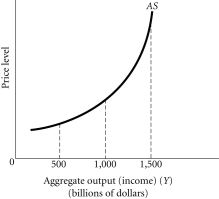 Figure 12.1
-Refer to Figure 12.1.At aggregate output levels above $1,500 billion,firms in this economy are most likely experiencing
Figure 12.1
-Refer to Figure 12.1.At aggregate output levels above $1,500 billion,firms in this economy are most likely experiencing
(Multiple Choice)
4.9/5 (37)
Refer to the information provided in Figure 12.2 below to answer the questions that follow.  Figure 12.2
-Refer to Figure 12.2.Between the output levels of $300 billion and $600 billion,the relationship between the price level and output is
Figure 12.2
-Refer to Figure 12.2.Between the output levels of $300 billion and $600 billion,the relationship between the price level and output is
(Multiple Choice)
4.8/5 (40)
Filters
- Essay(0)
- Multiple Choice(0)
- Short Answer(0)
- True False(0)
- Matching(0)