Exam 3: Demand, Supply, and Market Equilibrium
Exam 1: The Scope and Method of Economics238 Questions
Exam 2: The Economic Problem: Scarcity and Choice220 Questions
Exam 3: Demand, Supply, and Market Equilibrium298 Questions
Exam 4: Demand and Supply Applications173 Questions
Exam 5: Introduction to Macroeconomics241 Questions
Exam 6: Measuring National Output and National Income292 Questions
Exam 7: Unemployment, Inflation, and Long-Run Growth297 Questions
Exam 8: Aggregate Expenditure and Equilibrium Output355 Questions
Exam 9: The Government and Fiscal Policy362 Questions
Exam 10: Money, the Federal Reserve, and the Interest Rate358 Questions
Exam 11: The Determination of Aggregate Output, the Price Level, and the Interest Rate243 Questions
Exam 12: Policy Effects and Cost Shocks in the Asad Model200 Questions
Exam 13: The Labor Market in the Macroeconomy287 Questions
Exam 14: Financial Crises, Stabilization, and Deficits260 Questions
Exam 15: Household and Firm Behavior in the Macroeconomy: a Further Look364 Questions
Exam 16: Long-Run Growth196 Questions
Exam 17: Alternative Views in Macroeconomics294 Questions
Exam 18: International Trade, Comparative Advantage, and Protectionism301 Questions
Exam 19: Open-Economy Macroeconomics: the Balance of Payments and Exchange Rates308 Questions
Exam 20: Economic Growth in Developing Economies133 Questions
Exam 21: Critical Thinking About Research105 Questions
Select questions type
Refer to the information provided in Table 3.2 below to answer the questions that follow.
Table 3.2
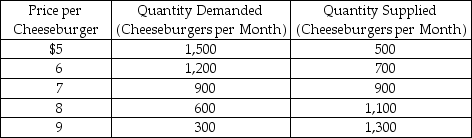 -Refer to Table 3.2. If the price per cheeseburger is $7, the price will
Free
(Multiple Choice)
4.8/5  (45)
(45)
Correct Answer: Verified
A
Refer to the information provided in Table 3.1 below to answer the questions that follow.
Table 3.1
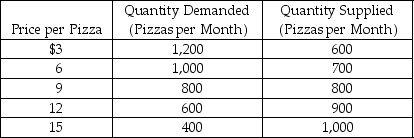 -Refer to Table 3.1. If the price per pizza is $6, there is an excess
Free
(Multiple Choice)
4.9/5 (42)
Correct Answer:Verified
A
Resources are exchanged in ________ markets.
Free
(Multiple Choice)
4.9/5 (33)
Correct Answer:Verified
B
Refer to the information provided in Table 3.2 below to answer the questions that follow.
Table 3.2
-Refer to Table 3.2. In this market there will be an excess demand of 500 cheeseburgers at a price of
(Multiple Choice)
4.8/5 (42)
In response to news reports that taking aspirin daily can reduce an individual's risk of a heart attack, there will most likely be a(n)
(Multiple Choice)
4.8/5 (36)
Suppose the demand for books goes down when the price of video games goes down. We can say that these two goods are
(Multiple Choice)
4.9/5 (35)
Which of the following will cause a shift in the demand curve for hoverboards?
(Multiple Choice)
4.8/5 (39)
According to the law of demand there is negative relationship between ________ and ________.
(Multiple Choice)
4.8/5 (36)
A technological advance in the production of digital video recorders will cause them to become less expensive.
(True/False)
4.9/5 (35)
If price is below the equilibrium, then quantity supplied will be less than quantity demanded putting upward pressure on price.
(True/False)
4.9/5 (34)
Refer to the information provided in Figure 3.10 below to answer the following questions. 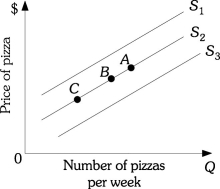 Figure 3.10
-Refer to Figure 3.10. A decrease in the wage rate of pizza makers will cause a movement from Point B on supply curve S2 to
Figure 3.10
-Refer to Figure 3.10. A decrease in the wage rate of pizza makers will cause a movement from Point B on supply curve S2 to
(Multiple Choice)
4.9/5 (31)
Refer to the information provided in Figure 3.15 below to answer the questions that follow. 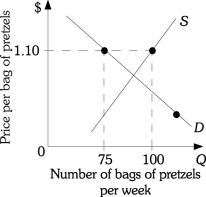 Figure 3.15
-Refer to Figure 3.15. The current quantity of bags of pretzels supplied is 100. You accurately predict that in this market
Figure 3.15
-Refer to Figure 3.15. The current quantity of bags of pretzels supplied is 100. You accurately predict that in this market
(Multiple Choice)
4.7/5 (37)
Refer to the information provided in Figure 3.10 below to answer the following questions. Figure 3.10
-Refer to Figure 3.10. A movement from Point C to Point B on supply curve S2 would be caused by a(n)
(Multiple Choice)
4.8/5 (37)
Refer to the information provided in Figure 3.13 below to answer the questions that follow. 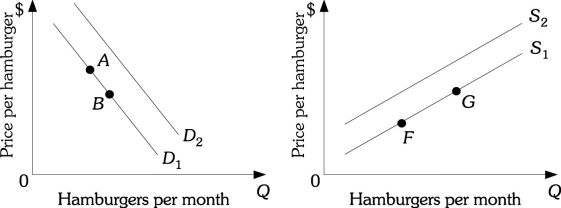 Figure 3.13
-Refer to Figure 3.13. Assume hamburgers and french fries are complements. A decrease in the price of french fries will cause a movement from
Figure 3.13
-Refer to Figure 3.13. Assume hamburgers and french fries are complements. A decrease in the price of french fries will cause a movement from
(Multiple Choice)
4.8/5 (35)
Refer to the information provided in Table 3.2 below to answer the questions that follow.
Table 3.2
-Refer to Table 3.2. This market will be in equilibrium if the price per cheeseburger is
(Multiple Choice)
4.7/5 (29)
Refer to the information provided in Figure 3.10 below to answer the following questions. Figure 3.10
-Refer to Figure 3.10. An increase in the price of pizza sauce will cause a movement from Point B on supply curve S2 to
(Multiple Choice)
4.9/5 (34)
Filters
- Essay(0)
- Multiple Choice(0)
- Short Answer(0)
- True False(0)
- Matching(0)