Exam 8: Aggregate Demand and Aggregate Supply
Exam 1: What Economics Is About168 Questions
Exam 2: Production Possibilities Frontier Framework149 Questions
Exam 3: Supply and Demand: Theory227 Questions
Exam 4: Prices: Free, controlled, and Relative105 Questions
Exam 5: Supply,demand,and Price: Applications67 Questions
Exam 6: Macroeconomic Measurements, Prices and Unemployment127 Questions
Exam 7: Macroeconomic Measurements, Gdp and Real Gdp138 Questions
Exam 8: Aggregate Demand and Aggregate Supply208 Questions
Exam 9: Classical Macroeconomics and the Self-Regulating Economy167 Questions
Exam 10: Keynesian Macroeconomics and Economic Instability: a Critique of the Self-Regulating Economy193 Questions
Exam 11: Fiscal Policy and the Federal Budget164 Questions
Exam 12: Money,banking,and the Financial System124 Questions
Exam 13: The Federal Reserve System179 Questions
Exam 14: Money and the Economy125 Questions
Exam 15: Monetary Policy176 Questions
Exam 16: Expectations Theory and the Economy146 Questions
Exam 17: Economic Growth: Resources, technology, ideas, and Institutions82 Questions
Exam 18: The Financial Crisis of 2007-200970 Questions
Exam 19: Debates in Macroeconomics Over the Role and Effects of Government69 Questions
Exam 20: Public Choice and Special-Interest-Group Politics131 Questions
Exam 21: Building Theories to Explain Everyday Life: From Observations to Questions to Theories to Predictions60 Questions
Exam 22: International Trade151 Questions
Exam 23: International Finance119 Questions
Exam 24: Globalization and International Impacts on the Economy135 Questions
Exam 25: The Economic Case for and Against Government: Five Topics Considered79 Questions
Exam 26: Stocks, bonds, futures, and Options106 Questions
Exam 27: Agriculture: Problems, policies, and Unintended Effects149 Questions
Select questions type
Exhibit 8-4 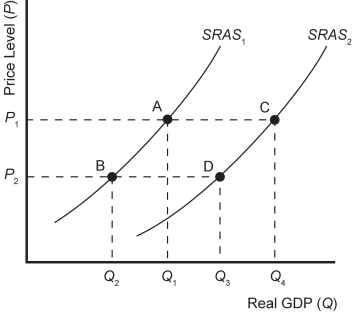 -Refer to Exhibit 8-4.A shift in short-run aggregate supply from SRAS1 to SRAS2 would have been the result of
(Multiple Choice)
4.8/5  (30)
(30)
Subprime loans generally have a lower loan-to-value ratio than do prime loans.
(True/False)
4.7/5 (41)
A fall in the price level changes the purchasing power of money.This is relevant to the __________ effect.
(Multiple Choice)
5.0/5 (36)
One reason the AD curve is downward sloping is the __________ effect.
(Multiple Choice)
4.8/5 (38)
Exhibit 8-1 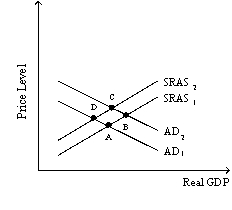 -Refer to Exhibit 8-1.Assume that the economy is originally in equilibrium at point B.If businesses become pessimistic about future sales,at which point is the economy most likely to end up in the short run?
(Multiple Choice)
4.9/5 (37)
The economy suffers an adverse supply shock.As a result,in the short run Real GDP will __________ and the price level will __________.
(Multiple Choice)
4.7/5 (37)
If foreign input prices increase and the United States purchases those inputs,then the U.S.
(Multiple Choice)
4.9/5 (45)
In the short run,an increase in investment,ceteris paribus,shifts the
(Multiple Choice)
4.7/5 (44)
Exhibit 8-1
-Refer to Exhibit 8-1.If we assume that the unemployment rate and Real GDP are inversely related,which of the points on this graph is most likely representative of the lowest unemployment rate?
(Multiple Choice)
4.8/5 (43)
A change in the quantity demanded of Real GDP is graphically represented as a
(Multiple Choice)
4.9/5 (36)
List and describe the three reasons that help to explain why the aggregate demand (AD)curve slopes downward.
(Essay)
5.0/5 (39)
The worker-misperception explanation of the SRAS curve is used to explain why
(Multiple Choice)
4.7/5 (41)
An increase in the money supply may __________ total expenditures,leading to a __________ shift of the AD curve.
(Multiple Choice)
5.0/5 (42)
If investment changes because of a change in the price level,then the
(Multiple Choice)
4.7/5 (48)
Filters
- Essay(0)
- Multiple Choice(0)
- Short Answer(0)
- True False(0)
- Matching(0)