Exam 12: The Aggregate Demand and Supply Model
Exam 1: The Policy and Practice of Macroeconomics82 Questions
Exam 2: Measuring Macroeconomic Data85 Questions
Exam 3: Aggregate Production and Productivity85 Questions
Exam 4: Saving and Investment in Closed and Open Economies85 Questions
Exam 5: Money and Inflation91 Questions
Exam 6: The Sources of Growth and the Solow Model86 Questions
Exam 7: Drivers of Growth: Technology, policy, and Institutions85 Questions
Exam 8: Business Cycles: an Introduction88 Questions
Exam 9: The Is Curve97 Questions
Exam 10: Monetary Policy and Aggregate Demand86 Questions
Exam 11: Aggregate Supply and the Phillips Curve85 Questions
Exam 12: The Aggregate Demand and Supply Model89 Questions
Exam 13: Macroeconomic Policy and Aggregate Demand and Supply Analysis100 Questions
Exam 14: The Financial System and Economic Growth85 Questions
Exam 15: Financial Crises and the Economy92 Questions
Exam 16: Fiscal Policy and the Government Budget92 Questions
Exam 17: Exchange Rates and International Economic Policy90 Questions
Exam 18: Consumption and Saving87 Questions
Exam 19: Investment74 Questions
Exam 20: The Labor Market, employment, and Unemployment88 Questions
Exam 21: The Role of Expectations in Macroeconomic Policy86 Questions
Exam 22: Modern Business Cycle Theory77 Questions
Select questions type
How does the aggregate supply curve differ from a supply curve for,say,bananas?
Free
(Essay)
4.9/5  (35)
(35)
Correct Answer: Verified
The supply curve for bananas indicates the quantities that producers are willing to sell at various prices.The aggregate supply curve indicates the rate of inflation that results from various levels of output,relative to potential output.When output is at potential,the rate of inflation is independent,so the long-run aggregate supply curve is vertical.When output varies from potential output,the tightening or slackening of labor and other input markets causes inflation to rise or fall.The supply curve for bananas reflects costs of production.The aggregate supply curve shows that deviations from potential output cause the cost of production and,thus,the price of output to vary.
The price of a barrel of oil doubled between 2007 and the middle of 2008.To make matters worse,a financial crisis hit the U.S.economy starting in August of 2007.Which of the following is true of the Chinese experience?
Free
(Multiple Choice)
4.8/5 (37)
Correct Answer:Verified
D
The March 2000 "tech bubble" burst caused the aggregate demand curve to shift to the left by ________.
Free
(Multiple Choice)
4.9/5 (44)
Correct Answer:Verified
B
The aggregate demand curve shifts to the right when there is ________.
(Multiple Choice)
4.8/5 (38)
Which of the following is (are)linked to (an)adverse supply shock(s)?
(Multiple Choice)
4.9/5 (39)
By the time Paul Volcker took office as the new Federal Reserve chairman in 1979,both the inflation and unemployment rates were higher than during most of the 1950s,60s and early 70s.The Federal Reserve implemented an autonomous tightening of monetary policy that resulted in the famous Volker Disinflation which was successful in bringing both problems under control.Which of the following is an appropriate description had Mr.Volker conducted an expansionary monetary policy instead?
(Multiple Choice)
4.9/5 (27)
The price of a barrel of oil doubled between 2007 and the middle of 2008.To make matters worse,a financial crisis hit the U.S.economy starting in August of 2007.Which of the following is an appropriate description of the mechanism that would have ensued?
(Multiple Choice)
4.7/5 (24)
AD - AS Equilibrium 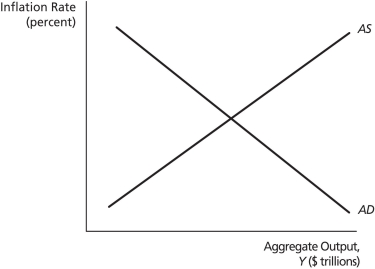 -On the graph above,if output is falling,while the quantity demanded is rising,the economy may be at a point on ________.
(Multiple Choice)
4.7/5 (35)
By the time Paul Volcker took office as the new Federal Reserve chairman in 1979,both the inflation and unemployment rates were higher than during most of the 1950s,60s and early 70s.The Federal Reserve implemented an autonomous tightening of monetary policy that resulted in the famous Volker Disinflation which was successful in bringing both problems under control.What would have been a likely long-run result had Mr.Volker conducted an expansionary monetary policy instead?
(Multiple Choice)
4.7/5 (41)
The endogenous variable in the aggregate demand curve is ________.
(Multiple Choice)
4.8/5 (38)
The aggregate demand curve is Y = 75 - 3π,and the short-run aggregate supply curve is π = 6.2 + 0.8(Y - 70).Assuming adaptive expectations,calculate the inflation rate and output for the next period.
(Essay)
4.8/5 (37)
Picture an economy that is in general equilibrium.What would happen if the natural rate of unemployment were to experience an increase?
(Multiple Choice)
4.9/5 (40)
If the unemployment rate is below its natural rate,then ________.
(Multiple Choice)
4.9/5 (34)
The aggregate demand curve shifts to the left when there is ________.
(Multiple Choice)
4.9/5 (34)
In 1973,the Organization of Petroleum Exporting Countries (OPEC)engineered a quadrupling of oil prices by restricting oil production.Which of the following is an appropriate description of this negative supply shock?
(Multiple Choice)
4.8/5 (36)
Rising inflation causes quantity demanded to decline,because ________.
(Multiple Choice)
4.8/5 (42)
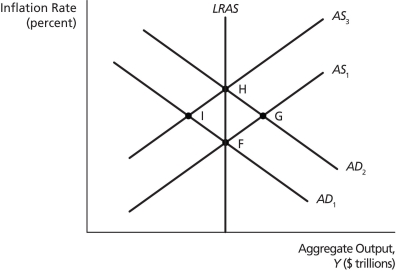 -On the graph above (and considering the short run only),a combination of a negative demand shock and a negative supply shock may be represented by the movement from point ________ to point ________.
(Multiple Choice)
4.8/5 (36)
Picture an economy that is in general equilibrium.What would happen if the natural rate of unemployment were to experience a decrease?
(Multiple Choice)
4.9/5 (44)
AD - AS Equilibrium
-On the graph above,if inflation is rising,while the quantity demanded and output are rising,the economy may be at a point on ________.
(Multiple Choice)
4.9/5 (37)
By the time Paul Volcker took office as the new Federal Reserve chairman in 1979,the inflation rate exceeded 10%.By 1982 the unemployment rate soared to 9.7% and inflation was cut to 6.2%.By the end of 1986 the unemployment rate was brought down to 7% and the inflation rate was brought further down to 1.9%.Which of the following is an appropriate description of the mechanism behind the Volcker Disinflation?
(Multiple Choice)
4.9/5 (35)
Filters
- Essay(0)
- Multiple Choice(0)
- Short Answer(0)
- True False(0)
- Matching(0)