Exam 6: The Sources of Growth and the Solow Model
Exam 1: The Policy and Practice of Macroeconomics82 Questions
Exam 2: Measuring Macroeconomic Data85 Questions
Exam 3: Aggregate Production and Productivity85 Questions
Exam 4: Saving and Investment in Closed and Open Economies85 Questions
Exam 5: Money and Inflation91 Questions
Exam 6: The Sources of Growth and the Solow Model86 Questions
Exam 7: Drivers of Growth: Technology, policy, and Institutions85 Questions
Exam 8: Business Cycles: an Introduction88 Questions
Exam 9: The Is Curve97 Questions
Exam 10: Monetary Policy and Aggregate Demand86 Questions
Exam 11: Aggregate Supply and the Phillips Curve85 Questions
Exam 12: The Aggregate Demand and Supply Model89 Questions
Exam 13: Macroeconomic Policy and Aggregate Demand and Supply Analysis100 Questions
Exam 14: The Financial System and Economic Growth85 Questions
Exam 15: Financial Crises and the Economy92 Questions
Exam 16: Fiscal Policy and the Government Budget92 Questions
Exam 17: Exchange Rates and International Economic Policy90 Questions
Exam 18: Consumption and Saving87 Questions
Exam 19: Investment74 Questions
Exam 20: The Labor Market, employment, and Unemployment88 Questions
Exam 21: The Role of Expectations in Macroeconomic Policy86 Questions
Exam 22: Modern Business Cycle Theory77 Questions
Select questions type
International evidence on the relationship of per capita income and the saving rate suggests that ________.
Free
(Multiple Choice)
4.8/5  (30)
(30)
Correct Answer: Verified
C
In a steady-state economy with no population growth,consumption per worker is 45,the saving rate is 25 percent,and the depreciation rate is 15 percent.The level of capital per worker is ________.
Free
(Multiple Choice)
4.8/5 (37)
Correct Answer:Verified
C
Other things the same,in the Solow model in the steady state,a higher rate of population growth ________ growth rate of output per worker.
Free
(Multiple Choice)
4.8/5 (46)
Correct Answer:Verified
C
The positive slope of the per-worker production function illustrates the relationship between per-worker output and ________.
(Multiple Choice)
4.9/5 (39)
Which of the following had the highest rate of growth during the period 1948-72?
(Multiple Choice)
4.8/5 (43)
Solow Diagram  -On the diagram above,show the quantity of consumption per worker in equilibrium.If the actual capital per worker were greater than k*,would consumption be higher or lower than it is in equilibrium? Describe what would happen in an economy with such a high level of capital per worker.
(Essay)
4.9/5 (38)
Solow Diagram 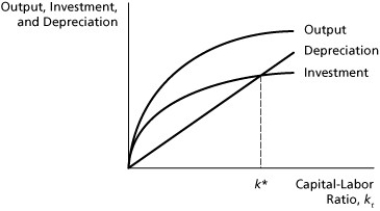 -The diagram above shows a steady state with a constant quantity of labor.Show on the graph how the steady state is determined if the labor force is growing at some constant rate.On the graph,show how to measure the change in consumption per worker that results from growth of the labor force.
(Essay)
4.8/5 (46)
The per-worker production function flattens out due to ________.
(Multiple Choice)
4.9/5 (31)
Evidence of a negative correlation between income per capita and population growth rates ________.
(Multiple Choice)
4.9/5 (33)
The loss of capital due to the wearing out of machines is known as ________.
(Multiple Choice)
4.8/5 (36)
Other things the same,in the Solow model in the steady state,a higher rate of population growth ________ the level of output per worker.
(Multiple Choice)
4.8/5 (46)
Output per worker  = 4
= 4  1/3,the saving rate is 30 percent,and the depreciation rate is 0.133.Calculate the steady-state values of capital per worker and consumption per worker.
(Essay)
4.9/5 (36)
In the Solow model,the faster growth of output that results from an increase in the saving rate is temporary,because ________.
(Multiple Choice)
4.8/5 (35)
The Solow model implies that continuous growth in productivity at a rate of one percent will result in continuous growth of output per worker at a rate of 1.43%.Thus,if at a point in time output per worker is 270 and productivity rises by one percent,the resulting level of output per worker is ________.
(Multiple Choice)
4.9/5 (37)
The label 'Asian Tigers' describes the following economies ________.
(Multiple Choice)
4.9/5 (32)
In the typical bathtub,the flow of water into the tub is controlled by a faucet independently of the quantity of water in the tub.How is the bathtub analogy of the steady state in the Solow model different? How does this difference relate to the phenomenon of convergence?
(Essay)
4.8/5 (36)
Filters
- Essay(0)
- Multiple Choice(0)
- Short Answer(0)
- True False(0)
- Matching(0)