Exam 6: Elasticity and Demand
Exam 1: Managers, profits, and Markets30 Questions
Exam 2: Demand, supply, and Market Equilibrium64 Questions
Exam 3: Marginal Analysis for Optimal Decision Making96 Questions
Exam 4: Basic Estimation Techniques19 Questions
Exam 5: Theory of Consumer Behavior69 Questions
Exam 6: Elasticity and Demand77 Questions
Exam 7: Demand Estimation and Forecasting65 Questions
Exam 8: Production and Cost in the Short Run100 Questions
Exam 9: Production and Cost in the Long Run89 Questions
Exam 10: Production and Cost Estimation55 Questions
Exam 11: Managerial Decisions in Competitive Markets90 Questions
Exam 12: Managerial Decisions for Firms With Market Power110 Questions
Exam 13: Strategic Decision Making in Oligopoly Markets42 Questions
Exam 14: Advanced Pricing Techniques57 Questions
Exam 15: Decisions Under Risk and Uncertainty60 Questions
Exam 16: Government Regulation of Business50 Questions
Select questions type
 In the figure above,what is the point price elasticity of demand when price is $40?
(Multiple Choice)
4.8/5  (33)
(33)
Use the figure below to calculate the cross-price elasticity of demand for good X when the price of good Y increases from $12 to $14:
(Multiple Choice)
4.9/5 (33)
 In the figure above,what is the interval elasticity of demand over the price range $60 to $80?
(Multiple Choice)
4.8/5 (35)
To answer the question,refer to the following table showing a demand schedule:  If price falls from $150 to $100,what is the elasticity of demand over this range?
(Multiple Choice)
4.8/5 (35)
If E1 is the demand elasticity for a product after a price change has been in effect one day,E2 is the demand elasticity for that product after one week,and E3 is demand elasticity for that product after one month,
(Multiple Choice)
4.7/5 (29)
Refer to the following figure.When price is $15 and quantity demanded is 1,000,what is the point elasticity of demand? 
(Multiple Choice)
4.8/5 (40)
To answer the question,refer to the following table showing a demand schedule:  If price falls from $200 to $150,
(Multiple Choice)
4.8/5 (36)
If a drought increases the price of corn by 10% and decreases the quantity of corn demanded by 5%,then demand for corn is
(Multiple Choice)
4.7/5 (45)
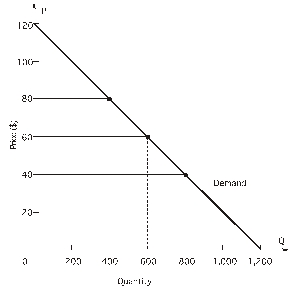 In the figure above,if price DECREASES from $80 to $60,an arrow representing the QUANTITY effect
(Multiple Choice)
4.8/5 (38)
Refer to the following figure.What is the equation for marginal revenue? 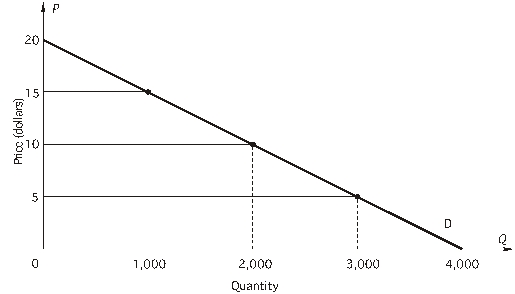
(Multiple Choice)
4.8/5 (30)
 In the figure above,what is the point price elasticity of demand when price is $60?
(Multiple Choice)
4.9/5 (39)
the figure below,which shows a linear demand curve and the associated total revenue curve,to answer the question. 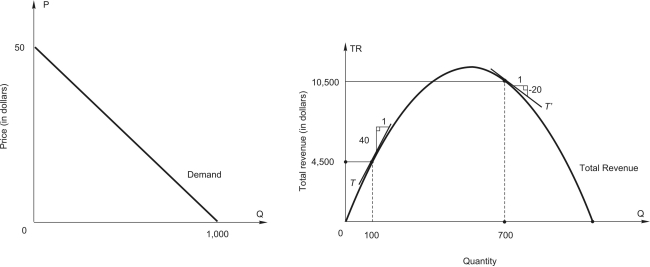 The maximum possible total revenue is $_________.
(Multiple Choice)
4.7/5 (30)
The fact that the cross-price elasticity of natural gas with respect to the price of fuel oil is 0.4 implies that
(Multiple Choice)
4.9/5 (37)
Demand is more elastic / less elastic)in the short run than in the long run
(Multiple Choice)
4.8/5 (30)
Refer to the following graph to answer the question: 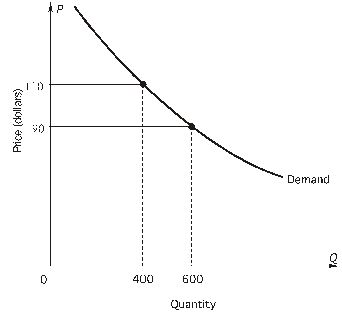 Suppose price rises from $90 to $110.Total revenue moves in the ________ same,opposite)direction as the dominant effect.In this case,total revenue ____________ increases,decreases,stays the same)because the quantity effect is _________ larger than,smaller than,the same as)the price effect.
(Multiple Choice)
4.8/5 (37)
Refer to the following figure.At a price of $10,the point elasticity of demand for D3 is ________ and marginal revenue is _______. 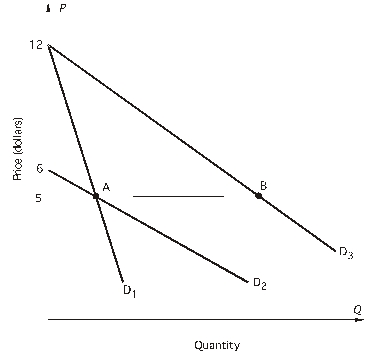
(Multiple Choice)
4.9/5 (41)
If the quantity of gidgets demanded increases when the price of gadgets decreases
(Multiple Choice)
4.8/5 (42)
To answer the question,refer to the following table showing a demand schedule:  As output increases from 1,000 to 1,400 what is marginal revenue?
(Multiple Choice)
4.9/5 (40)
Use the figure to calculate the income elasticity of demand when income increases from $25,000 to $30,000: 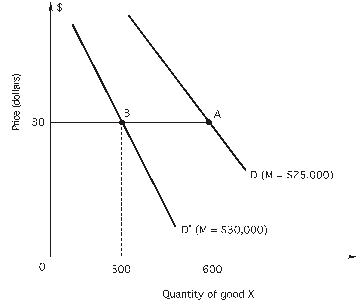
(Multiple Choice)
4.9/5 (36)
Filters
- Essay(0)
- Multiple Choice(0)
- Short Answer(0)
- True False(0)
- Matching(0)