Multiple Choice
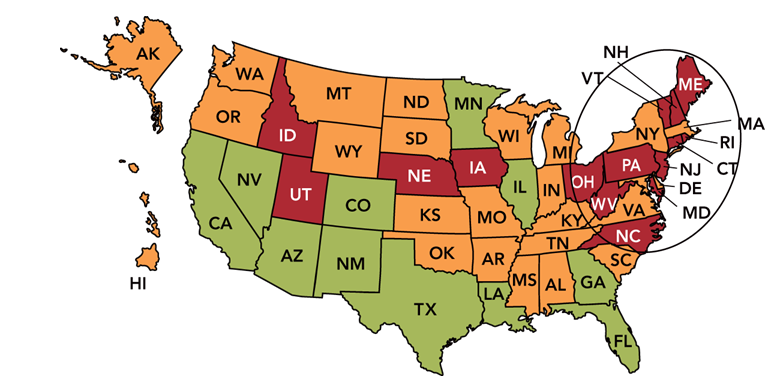
-N the Marketing Dashboard Map above,the annual growth rate in each state is shown,with green meaning good and red meaning very bad.If an organization's 2012 sales for the entire U.S.were $50 million and its 2011 U.S.sales were $30 million,what is the annual % sales change?
A) 33%
B) 67%
C) 100%
D) 125%
E) 133%
Correct Answer:

Verified
Correct Answer:
Verified
Q5: One of the six ORGANIZATION-RELATED problems that
Q6: Business products are also referred to as
Q8: A product that requires no new behaviors
Q12: The seven stages an organization goes through
Q166: The type of business products known as
Q174: Screening and evaluation refers to the stage
Q194: A situation that occurs when a service
Q226: Kimberly-Clark developed its Avert Virucidal tissues that
Q237: Items consumed in one or a few
Q339: The new-product process refers to<br>A)the informal process