Multiple Choice
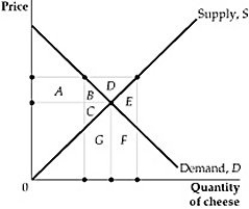 Figure 9.4.1
-Refer to Figure 9.4.1 above. Suppose the government raises the price of cheese above the market equilibrium level (P0) by imposing a high minimum price and purchasing all of the excess supply from the market, and these quantities are destroyed. Based on the areas in the figure below, what is the deadweight loss of this program?
A) Deadweight loss is area E+F+G.
B) Deadweight loss is area B+C+E+F+G.
C) Deadweight loss is area D.
D) Deadweight loss is area B+C+D+E+F+G.
Correct Answer:

Verified
Correct Answer:
Verified
Q111: The market demand curve for a popular
Q112: <img src="https://d2lvgg3v3hfg70.cloudfront.net/TB3095/.jpg" alt=" Figure 9.1.2 -Refer
Q113: For national security reasons a government decides
Q114: The market demand and supply functions for
Q115: The local community is considering two options
Q117: Deadweight loss refers to:<br>A) losses in consumer
Q118: The market demand and supply functions for
Q119: <img src="https://d2lvgg3v3hfg70.cloudfront.net/TB3095/.jpg" alt=" Figure 9.1.2 -Refer
Q120: Consider a good whose own price elasticity
Q121: What is the difference between a price