Multiple Choice
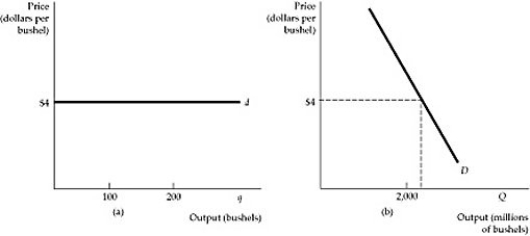 Figure 8.3.2
-Refer to Figure 8.3.2 above. The demand of a price taker is illustrated:
A) in panel (a) .
B) in panel (b)
C) in both panels.
D) by neither curve.
Correct Answer:

Verified
Correct Answer:
Verified
Related Questions
Q2: The amount of output that a firm
Q3: A price taker is:<br>A) a firm that
Q4: A competitive market is made up of
Q5: <img src="https://d2lvgg3v3hfg70.cloudfront.net/TB3095/.jpg" alt=" Figure 8.7.3 -Refer
Q6: In the local cotton market, there are
Q7: <img src="https://d2lvgg3v3hfg70.cloudfront.net/TB3095/.jpg" alt=" Figure 8.5.1 -The
Q8: The demand curve facing a perfectly competitive
Q9: Because of the relationship between a perfectly
Q10: Marginal revenue, graphically, is:<br>A) the slope of
Q11: Scenario 8.2:<br>Yachts are produced by a perfectly