Short Answer
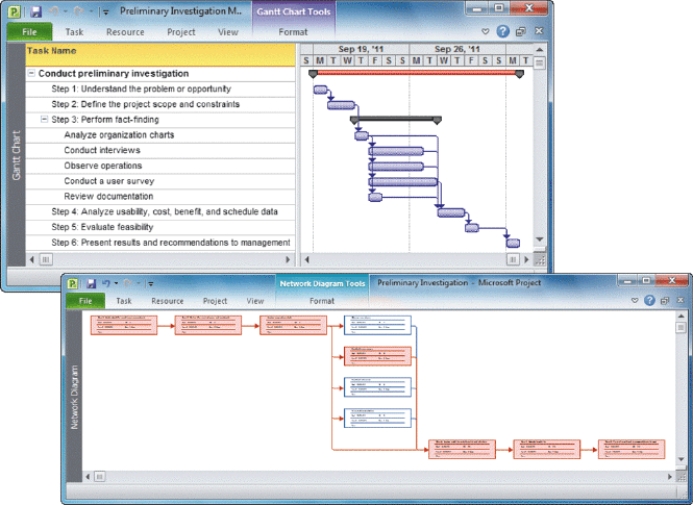
-The chart in the accompanying figure represents a bottom-up technique, because it analyzes a large, complex project as a series of individual ____________________.
Correct Answer:

Verified
Correct Answer:
Verified
Q8: Quantitative risk analysis evaluates each risk by
Q19: Matching<br>Identify the letters of the choices that
Q25: The first step in the creation of
Q36: <img src="https://d2lvgg3v3hfg70.cloudfront.net/TB5608/.jpg" alt=" -A(n) _ represents
Q47: Generally,systems analysts review the work of other
Q61: In Open Workbench, unlike in Microsoft Project,
Q63: In developing time and cost estimates, project
Q78: MATCHING<br>Identify the letter of the choice that
Q89: When two or more concurrent tasks depend
Q110: <img src="https://d2lvgg3v3hfg70.cloudfront.net/TB5608/.jpg" alt=" -To schedule a