Multiple Choice
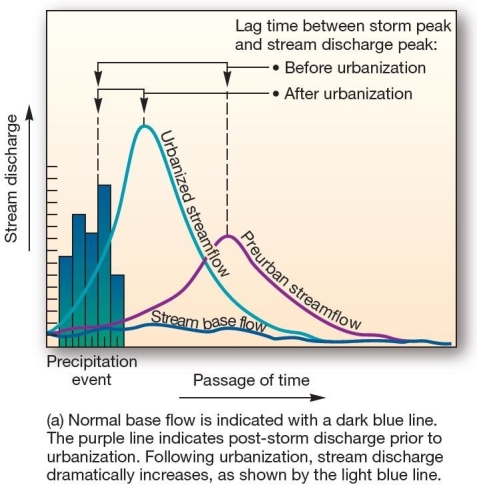 This graph,showing the effects of urbanization on streamflow over time,is an example of a
A) water budget.
B) hydrograph.
C) climograph.
D) hydrological cycle.
E) cladogram.
Correct Answer:

Verified
Correct Answer:
Verified
Q89: A stream's volume of flow per unit
Q90: The process whereby streams lengthen their channels
Q91: A(n)_is a meander that becomes isolated from
Q92: In most river basins in humid regions,discharge
Q93: The general term for channelized water flow,regardless
Q94: If you live in an area that
Q95: Erosion in which boulders and gravel moving
Q96: The ultimate base level is<br>A)a drainage divide.<br>B)a
Q97: Natural levees are created during<br>A)floods.<br>B)normal flow conditions.<br>C)low
Q98: <img src="https://d2lvgg3v3hfg70.cloudfront.net/TB5538/.jpg" alt=" This drainage pattern