Multiple Choice
Exhibit 5-6 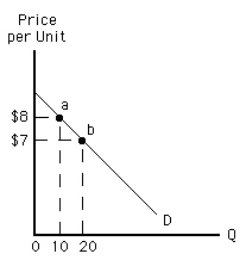 We can tell that demand is elastic as price falls between point a and point b in Exhibit 5-6 because
A) quantity demanded is increasing
B) total revenue is increasing
C) total revenue is decreasing
D) total revenue is unchanged
E) the demand curve slopes downward
Correct Answer:

Verified
Correct Answer:
Verified
Q51: If its value of cross-price elasticity is
Q52: Exhibit 5-27 <img src="https://d2lvgg3v3hfg70.cloudfront.net/TB6784/.jpg" alt="Exhibit 5-27
Q53: Exhibit 5-28 <img src="https://d2lvgg3v3hfg70.cloudfront.net/TB6784/.jpg" alt="Exhibit 5-28
Q54: A perfectly elastic supply curve<br>A)has no relevance,
Q55: The midpoint price between $20 and $40
Q57: Exhibit 5-27 <img src="https://d2lvgg3v3hfg70.cloudfront.net/TB6784/.jpg" alt="Exhibit 5-27
Q58: If an increase in the price of
Q59: Along a linear demand curve, as the
Q60: The demand for a good is elastic
Q61: Exhibit 5-11 <img src="https://d2lvgg3v3hfg70.cloudfront.net/TB6784/.jpg" alt="Exhibit 5-11