Multiple Choice
Exhibit 5-27 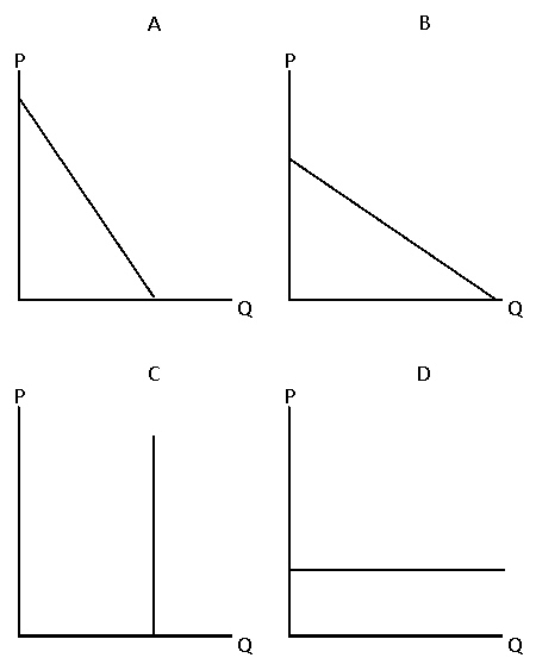 Consider Exhibit 5-27.Which graph depicts a perfectly inelastic demand?
A) Graph A
B) Graph B
C) Graph C
D) Graph D
E) both graphs A and B
Correct Answer:

Verified
Correct Answer:
Verified
Q47: If income rises and the demand for
Q49: Computers and software programs are<br>A)inferior goods<br>B)complementary goods<br>C)goods
Q50: Some demand curves have constant elasticity everywhere.
Q51: If its value of cross-price elasticity is
Q53: Exhibit 5-28 <img src="https://d2lvgg3v3hfg70.cloudfront.net/TB6784/.jpg" alt="Exhibit 5-28
Q54: A perfectly elastic supply curve<br>A)has no relevance,
Q55: The midpoint price between $20 and $40
Q56: Exhibit 5-6 <img src="https://d2lvgg3v3hfg70.cloudfront.net/TB6784/.jpg" alt="Exhibit 5-6
Q57: Exhibit 5-27 <img src="https://d2lvgg3v3hfg70.cloudfront.net/TB6784/.jpg" alt="Exhibit 5-27
Q158: Which of the following describes a situation