Multiple Choice
Use the following to answer question: 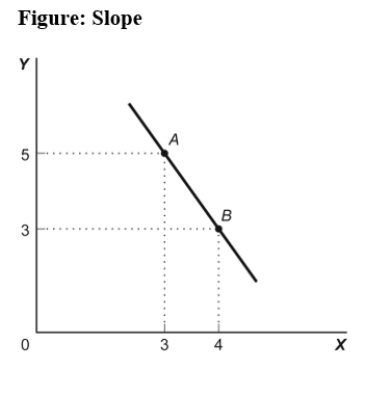
-(Figure: Slope) Use Figure: Slope.The slope of the line in the graph can be calculated by:
A) dividing the horizontal change by the vertical change.
B) dividing the vertical change by the horizontal change.
C) subtracting the sum of the Y values from the sum of the X values.
D) adding the sum of the X values to the sum of the Y values.
Correct Answer:

Verified
Correct Answer:
Verified
Q7: The _ of a curve shows the
Q8: In a time-series graph,large changes can be
Q9: Use the following to answer question: <img
Q10: Use the following to answer question: <img
Q11: Use the following to answer question:<br><img src="https://d2lvgg3v3hfg70.cloudfront.net/TB6643/.jpg"
Q13: Professor Macro wants to use a numerical
Q14: Use the following to answer question: <img
Q15: In the graph of a curve,the vertical
Q16: If two variables are negatively related,they will
Q17: The relation between two variables that move