Multiple Choice
Use the following to answer question: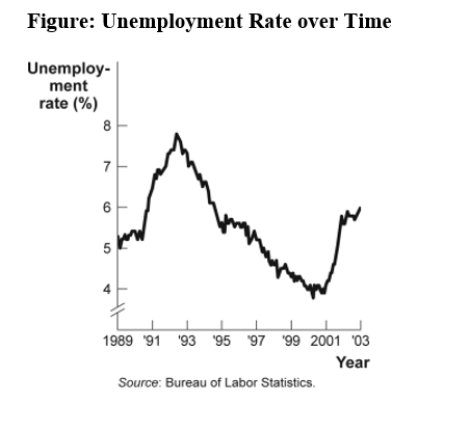
-(Figure: Unemployment Rate over Time) Use Figure: Unemployment Rate over Time.In the time-series graph,as we move from 1991 to 1993,we see that the unemployment rate has _____ from approximately _____% to approximately _____%.
A) decreased;5;4
B) increased;5.5;7
C) decreased;7.8;5
D) increased;4;6.3
Correct Answer:

Verified
Correct Answer:
Verified
Q6: The point at which the axes of
Q7: The _ of a curve shows the
Q8: In a time-series graph,large changes can be
Q9: Use the following to answer question: <img
Q10: Use the following to answer question: <img
Q12: Use the following to answer question: <img
Q13: Professor Macro wants to use a numerical
Q14: Use the following to answer question: <img
Q15: In the graph of a curve,the vertical
Q16: If two variables are negatively related,they will