Multiple Choice
Use the figure below to answer the following questions. 
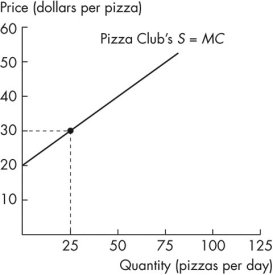 Figure 5.2.5a Figure 5.2.5b
-Figure 5.2.5 shows the supply curve for Pizza House's pizzas in the left graph and the supply curve for Pizza Club's pizzas in the right graph.If the price of a pizza is $20,what is the quantity supplied by the market if Pizza House and Pizza Club are the only firms?
A) 50
B) zero
C) 25
D) 75
E) 20
Correct Answer:

Verified
Correct Answer:
Verified
Q103: Use the figure below to answer the
Q104: Use the figure below to answer the
Q105: Use the figure below to answer the
Q106: Use the information below to answer the
Q107: A used truck has a sticker price
Q109: Marginal cost<br>A)is less than price.<br>B)can be negative.<br>C)is
Q110: Alvin Roth of Harvard University designed a
Q111: Use the table below to answer the
Q112: Use the figure below to answer the
Q113: Use the figure below to answer the