Multiple Choice
Use the figure below to answer the following question. 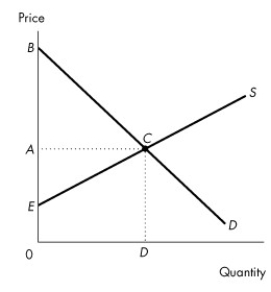 Figure 5.3.3
-Consider the demand and supply curves in Figure 5.3.3.If the market is at the competitive equilibrium,which area in the diagram indicates producer surplus?
A) ABC
B) AEC
C) EBC
D) 0BCD
E) 0ECD
Correct Answer:

Verified
Correct Answer:
Verified
Q108: Use the figure below to answer the
Q109: Marginal cost<br>A)is less than price.<br>B)can be negative.<br>C)is
Q110: Alvin Roth of Harvard University designed a
Q111: Use the table below to answer the
Q112: Use the figure below to answer the
Q114: Majority rule allocates resources in the way
Q115: Use the table below to answer the
Q116: When the efficient quantity is produced<br>A)marginal social
Q117: A negative externality results in<br>A)underproduction.<br>B)zero production.<br>C)overproduction.<br>D)efficient production.<br>E)zero
Q118: Which of the following ideas describes the