Multiple Choice
Use the figure below to answer the following questions. 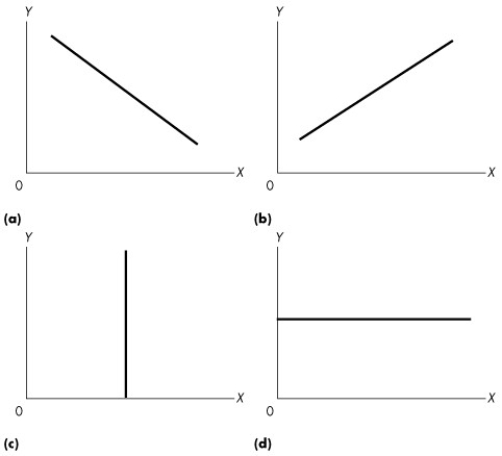 Figure 1A.2.4
-Refer to Figure 1A.2.4.If economic theory predicts that higher levels of the rate of interest (x) lead to lower levels of sales of houses (y) ,which graph represents this economic relationship?
A) (a)
B) (b)
C) (c)
D) (d)
E) (a) or (d)
Correct Answer:

Verified
Correct Answer:
Verified
Q107: If variables x and y move up
Q108: The inescapable economic fact is that<br>A)there are
Q109: Which of the following creates an incentive
Q110: The concept of opportunity cost<br>A)is used in
Q111: Use the figure below to answer the
Q113: Which of the following is a positive
Q114: A star athlete can afford a garage
Q115: Use the figure below to answer the
Q116: Model A is superior to model B
Q117: Use the figure below to answer the