Multiple Choice
Use the figure below to answer the following questions. 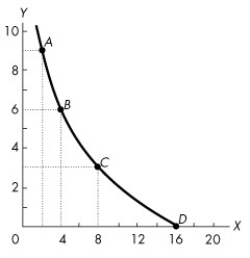 Figure 1A.3.4
-Figure 1A.3.4 illustrates two variables,x and y,which are
A) negatively related,with slope becoming closer to 0 as x increases from 2 to 16.
B) negatively related,with slope becoming farther from 0 as x increases from 2 to 16.
C) positively related,with slope becoming closer to 0 as x increases from 2 to 16.
D) positively related,with slope becoming farther from 0 as x increases from 2 to 16.
E) positively related,with the slope unchanging as x increases from 2 to 16.
Correct Answer:

Verified
Correct Answer:
Verified
Q110: The concept of opportunity cost<br>A)is used in
Q111: Use the figure below to answer the
Q112: Use the figure below to answer the
Q113: Which of the following is a positive
Q114: A star athlete can afford a garage
Q116: Model A is superior to model B
Q117: Use the figure below to answer the
Q118: Use the figure below to answer the
Q119: The problem of scarcity applies<br>A)to all countries,regardless
Q120: Given the data in Table 1A.4.2,holding price