Multiple Choice
The figure shows a graph of the acceleration of an object as a function of the net force acting on it. The mass of this object, in grams, is closest to 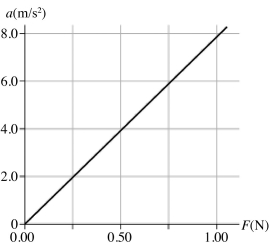
A) 130.
B) 11.
C) 89.
D) 8000.
Correct Answer:

Verified
Correct Answer:
Verified
Related Questions
Q11: If a 5.0 kg box is pulled
Q15: The figure shows two forces, each of
Q17: Point P in the figure indicates the
Q18: The graph in the figure shows the
Q20: The figure shows two forces acting at
Q22: An object is moving forward with a
Q24: Two forces act on a 55-kg object.
Q30: A 7.0-kg object is acted on by
Q41: You are standing in a moving bus,facing
Q59: A child on a sled starts from