Essay
The graph in the figure shows the net force acting on a 3.0-kg object as a function of time. 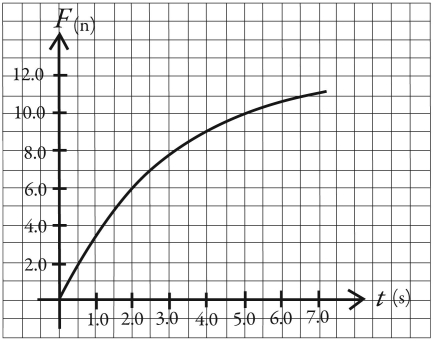
(a) What is the acceleration of this object at time t = 2.0 s?
(b) Draw, to scale, a graph of the acceleration of this object as a function of time over the range t = 0.00 s to t = 7.0 s.
Correct Answer:

Verified
(a) 2.0 m/s2
(b) The accelerati...View Answer
Unlock this answer now
Get Access to more Verified Answers free of charge
Correct Answer:
Verified
(b) The accelerati...
View Answer
Unlock this answer now
Get Access to more Verified Answers free of charge
Q11: If a 5.0 kg box is pulled
Q13: Which one of the following free-body diagrams
Q15: The figure shows two forces, each of
Q17: Point P in the figure indicates the
Q19: The figure shows a graph of the
Q20: The figure shows two forces acting at
Q22: An object is moving forward with a
Q30: A 7.0-kg object is acted on by
Q41: You are standing in a moving bus,facing
Q59: A child on a sled starts from