Multiple Choice
The figure shows a pV diagram for 8.3 g of nitrogen gas (N2) in a sealed container. The temperature T1 of the gas in state 1 is 79°C. What are (a) the pressure p1 of the gas in state 1 and (b) the temperature T2 of the gas in state 2? The ideal gas constant is R = 8.314 J/mol ∙ K = 0.0821 L ∙ atm/mol ∙ K, and the ATOMIC weight of nitrogen is 14 g/mol. 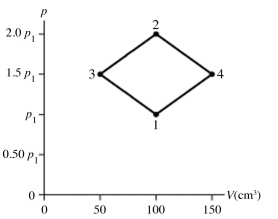
A) (a) 86 atm, (b) 700°C.
B) (a) 19 atm, (b) 700°C.
C) (a) 86 atm, (b) 160°C.
D) (a) 19 atm, (b) 160°C.
Correct Answer:

Verified
Correct Answer:
Verified
Q5: The figure shows a 50-kg frictionless cylindrical
Q7: If a certain sample of an ideal
Q8: How many moles of water (H<sub>2</sub>O)molecules are
Q10: A sealed 26- m<sup>3</sup> tank is filled
Q12: For a fixed amount of gas,if the
Q16: A bag of potato chips contains 2.00
Q17: A 3.2-L volume of neon gas (Ne)is
Q26: A 25-L container holds ideal hydrogen (H<sub>2</sub>)gas
Q32: The interior of a refrigerator has a
Q57: A hot air balloon has a volume