Multiple Choice
The figure shows a pV diagram for 0.0066 mol of gas that undergoes the process 1 → 2 → 3. What is the pressure p2. The ideal gas constant is R = 8.314 J/mol ∙ K = 0.0821 L ∙ atm/mol ∙ K. 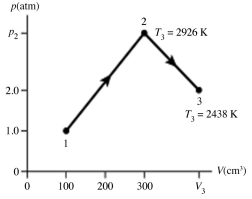
A) 5.3 atm
B) 5.3 × 10⁵ atm
C) 16 atm
D) 1.6 × 10⁶ atm
Correct Answer:

Verified
Correct Answer:
Verified
Related Questions
Q10: (a)Internal human body temperature is often stated
Q11: Which contains more moles of material: 80
Q12: A vertical tube that is closed at
Q18: What is the mass density of argon
Q19: A sealed 89-m<sup>3</sup> tank is filled with
Q20: The figure (not to scale) shows a
Q20: Sometimes an experiment requires a certain pure
Q22: A fixed amount of ideal gas is
Q22: 2.0 L of a ideal nitrogen gas
Q46: An ideal gas is at a pressure