Multiple Choice
Figure 16-3
Panel (a) Panel (b) 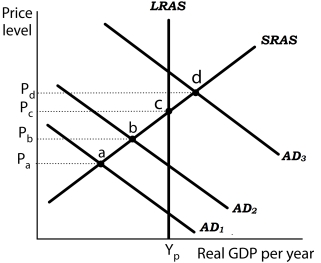
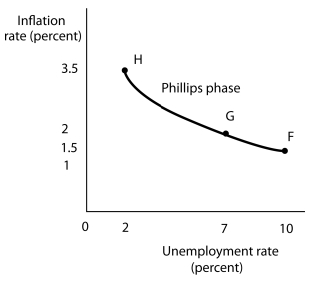 Suppose the level of potential output (YP) is $1,000 billion and the natural rate of unemployment is 5%. In Panel (a) , the aggregate demand curve in Period 1 is AD1. Assume that the price level in Period 1 has risen by 1.5% from the previous period and the unemployment rate is 10%. Thus, in Panel (b) point F shows an initial rate of inflation of 1.5% and an unemployment rate of 10%. Similarly, point b in Panel (a) corresponds to point G in Panel (b) and point d in Panel (a) corresponds to point H in Panel (b) .
-Refer to Figure 16-3. In the Phillips phase of the inflation-unemployment cycle,
A) aggregate demand is stagnant.
B) real GDP rises in each successive period.
C) inflation and unemployment fall in each successive period.
D) real GDP falls in each successive period.
Correct Answer:

Verified
Correct Answer:
Verified
Q8: Which of the following statements is true?<br>A)
Q10: Which of the following statements is true
Q11: Figure 16-3<br>Panel (a) Panel (b) <img src="https://d2lvgg3v3hfg70.cloudfront.net/TB5507/.jpg"
Q15: The critical feature of the<br>A) Phillips phase
Q17: A recovery phase if<br>A) prices and wages
Q18: In early in 1994, the Federal Reserve
Q19: Figure 16-4 <img src="https://d2lvgg3v3hfg70.cloudfront.net/TB5507/.jpg" alt="Figure 16-4
Q106: Using the equation of exchange, the rate
Q107: From 1992 through 2000, the United States
Q121: In a recovery phase,<br>A) inflation and unemployment