Multiple Choice
Figure 16-3
Panel (a) Panel (b) 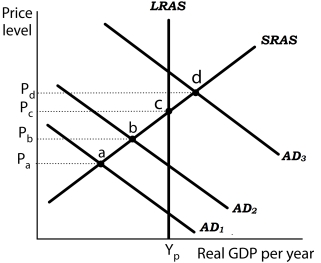
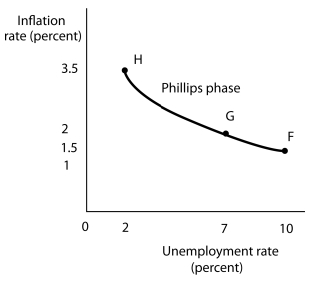 Suppose the level of potential output (YP) is $1,000 billion and the natural rate of unemployment is 5%. In Panel (a) , the aggregate demand curve in Period 1 is AD1. Assume that the price level in Period 1 has risen by 1.5% from the previous period and the unemployment rate is 10%. Thus, in Panel (b) point F shows an initial rate of inflation of 1.5% and an unemployment rate of 10%. Similarly, point b in Panel (a) corresponds to point G in Panel (b) and point d in Panel (a) corresponds to point H in Panel (b) .
-Refer to Figure 16-3. Suppose the economy is operating at point a. If policymakers Jundertake expansionary policies in period 1, what happens if there are lags in the application
Jof policy?
A) The economy may not experience any change in the price level or level of employment.
B) The economy could move past full employment to AD3 and encounter an inflationary gap.
C) The economy could be stuck in a below full-employment equilibrium such as at point b.
D) The economy could experience deflation resulting in a movement along the Phillips phase from point G to point F.
Correct Answer:

Verified
Correct Answer:
Verified
Q8: Which of the following statements is true?<br>A)
Q10: Which of the following statements is true
Q10: As the duration of job search increases,
Q14: Figure 16-3<br>Panel (a) Panel (b) <img src="https://d2lvgg3v3hfg70.cloudfront.net/TB5507/.jpg"
Q15: The critical feature of the<br>A) Phillips phase
Q48: A period marked by rising unemployment and
Q76: If a Phillips curve relationship between inflation
Q106: Using the equation of exchange, the rate
Q107: From 1992 through 2000, the United States
Q121: In a recovery phase,<br>A) inflation and unemployment