Essay
Refer to the table below. Analyze the data on the number of meals served at small and large restaurants. The number of meals served will vary with the number of cooks employed at the restaurant. 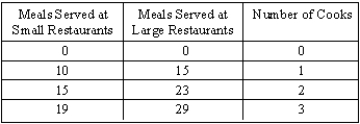

Correct Answer:

Verified
Correct Answer:
Verified
Q14: Exhibit 2A-5<br> <img src="https://d2lvgg3v3hfg70.cloudfront.net/TB6906/.jpg" alt="Exhibit 2A-5
Q22: Consider a ratio for the total number
Q24: The table below shows the inflation rate
Q26: Graph the relationship between X and Y
Q44: Exhibit 2A-8 <img src="https://d2lvgg3v3hfg70.cloudfront.net/TB6906/.jpg" alt="Exhibit 2A-8
Q49: An inverse relationship between two variables indicates
Q60: Exhibit 2A-5<br> <img src="https://d2lvgg3v3hfg70.cloudfront.net/TB6906/.jpg" alt="Exhibit 2A-5
Q89: Exhibit 2A-4 <img src="https://d2lvgg3v3hfg70.cloudfront.net/TB6906/.jpg" alt="Exhibit 2A-4
Q91: A positive relationship represents a situation where
Q121: Consider a straight line with a slope