Multiple Choice
The figure shows a pV diagram for 8.3 g of nitrogen gas (N2) in a sealed container.The temperature T1 of the gas in state 1 is 79°C.What are (a) the pressure p1 of the gas in state 1 and (b) the temperature T2 of the gas in state 2? The ideal gas constant is R = 8.314 J/mol ∙ K =  ,and the ATOMIC weight of nitrogen is 14 g/mol.
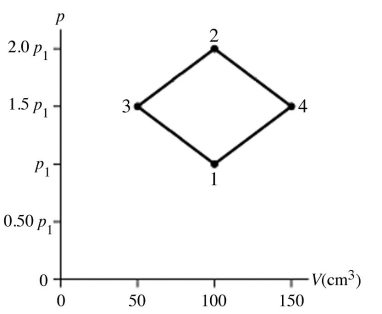
A) (a) 86 atm,(b) 700°C.
B) (a) 19 atm,(b) 700°C.
C) (a) 86 atm,(b) 160°C.
D) (a) 19 atm,(b) 160°C.
Correct Answer:

Verified
Correct Answer:
Verified
Q7: A rod has a length 2.00000 m
Q8: 1)000 L of water at 20.00°C will
Q10: (a)Internal human body temperature is often stated
Q16: A bag of potato chips contains 2.00
Q25: If a certain sample of an ideal
Q26: A 25-L container holds ideal hydrogen (H<sub>2</sub>)gas
Q27: 2.0 L of an ideal nitrogen gas
Q28: The number of molecules in one mole
Q32: The interior of a refrigerator has a
Q46: When a vapor condenses,<br>A) the temperature of