Essay
Refer to the table below, which shows data for the United States. 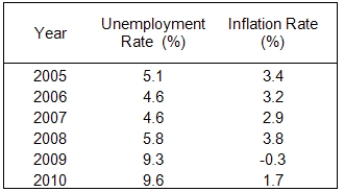 (A)Construct a time-series plot of the unemployment rate.
(B)Construct a time-series plot of the inflation rate.
(C)Construct a scatter plot of the data. Is there any apparent correlation between the inflation rate and the unemployment rate in these data?
Correct Answer:

Verified
Correct Answer:
Verified
Q3: Graph the relationship between X and Y
Q13: A two-dimensional graph cannot be used to
Q15: A curve shows that every time family
Q24: Consider a ratio for the total number
Q49: An inverse relationship between two variables indicates
Q62: Exhibit 2A-3 <img src="https://d2lvgg3v3hfg70.cloudfront.net/TB6906/.jpg" alt="Exhibit 2A-3
Q81: Exhibit 2A-7 <img src="https://d2lvgg3v3hfg70.cloudfront.net/TB6906/.jpg" alt="Exhibit 2A-7
Q88: Exhibit 2A-4 <img src="https://d2lvgg3v3hfg70.cloudfront.net/TB6906/.jpg" alt="Exhibit 2A-4
Q134: Exhibit 2A-3 <img src="https://d2lvgg3v3hfg70.cloudfront.net/TB6906/.jpg" alt="Exhibit 2A-3
Q137: A two-dimensional diagram can be represented by