Essay
A quality analyst wants to construct a sample mean chart for controlling a packaging process. He knows from past experience that the process standard deviation is two ounces. Each day last week, he randomly selected four packages and weighed each. The data from that activity appears below.
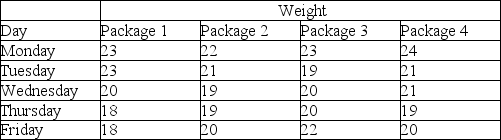 (a) Calculate all sample means and the mean of all sample means.
(b) Calculate upper and lower control limits that allow for natural variations.
(c) Is this process in control?
Correct Answer:

Verified
(a) The five sample means are 23, 21, 20...View Answer
Unlock this answer now
Get Access to more Verified Answers free of charge
Correct Answer:
Verified
View Answer
Unlock this answer now
Get Access to more Verified Answers free of charge
Q21: Plots of sample ranges indicate that the
Q49: The upper and lower limits for diving
Q101: Acceptance sampling is usually used to control<br>A)
Q110: Why do range charts exist? Aren't x-bar
Q112: What is acceptance sampling?
Q115: Which of the following statements on acceptance
Q116: An operator trainee is attempting to monitor
Q119: The statistical definition of Six Sigma allows
Q147: Control charts for variables are based on
Q205: _ is a method of measuring samples