Essay
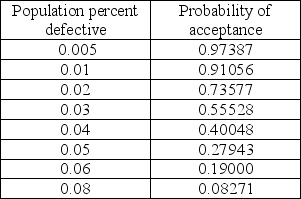
In the table below are selected values for the OC curve associated with the acceptance sampling plan n=50, c=1. (Watch out--the points are not evenly spaced.) Assume that upon failed inspection, defective items are replaced. Calculate the AOQ for each data point. (You may assume that the population is much larger than the sample.) Plot the AOQ curve. At approximately what population defective rate is the AOQ at its worst? Explain how this happens. How well does this plan meet the specifications of AQL=0.0050, α =0.05; LTPD=0.05, β =0.10? Discuss.
Correct Answer:

Verified
This plan does not meet the sp...View Answer
Unlock this answer now
Get Access to more Verified Answers free of charge
Correct Answer:
Verified
View Answer
Unlock this answer now
Get Access to more Verified Answers free of charge
Q21: Plots of sample ranges indicate that the
Q49: The upper and lower limits for diving
Q50: Consumer's risk is the probability of:<br>A)accepting a
Q54: Can "in control" and "capable" be shown
Q109: The statistical process chart used to control
Q110: Why do range charts exist? Aren't x-bar
Q115: Which of the following statements on acceptance
Q116: An operator trainee is attempting to monitor
Q127: An acceptance sampling plan is to be
Q132: What is the basic objective of a