Multiple Choice
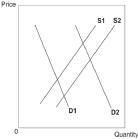
-Moving from demand curve D1 to demand curve D2 illustrates a(n)
A) increase in quantity demanded.
B) increase in demand.
C) decrease in demand.
D) increase in quantity supplied.
E) decrease in quantity demanded.
Correct Answer:

Verified
Correct Answer:
Verified
Q57: If the price of network servers increases,the
Q58: One of the assumptions of the supply
Q59: <img src="https://d2lvgg3v3hfg70.cloudfront.net/TB3713/.jpg" alt=" -Moving from supply
Q60: At the beginning of the fall semester,university
Q61: <img src="https://d2lvgg3v3hfg70.cloudfront.net/TB3713/.jpg" alt=" -Which of the
Q63: Market Equilibrium and Shifts in Demand and
Q64: Without the aid of a graph,one can
Q65: <img src="https://d2lvgg3v3hfg70.cloudfront.net/TB3713/.jpg" alt=" -As the price
Q66: When we move down along a given
Q67: Without the aid of a graph,one can